BIG ANNOUNCEMENT: I'm beyond excited to announce that in 5 days, I'm launching my brand new course- The #Python for Machine Learning & API's Course.
This course will transform your #career.
Here's what's inside... 🧵
#datascience #course
This course will transform your #career.
Here's what's inside... 🧵
#datascience #course

This launch marks the culmination of 2 years of research...
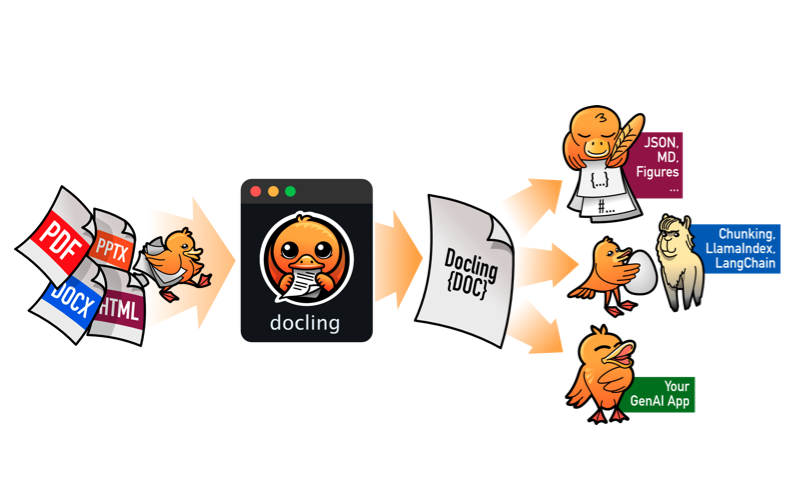
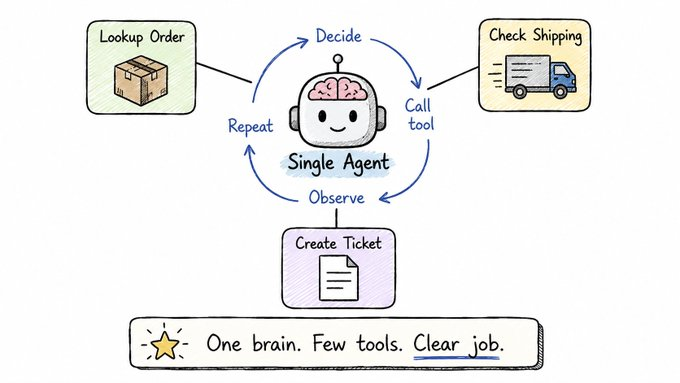
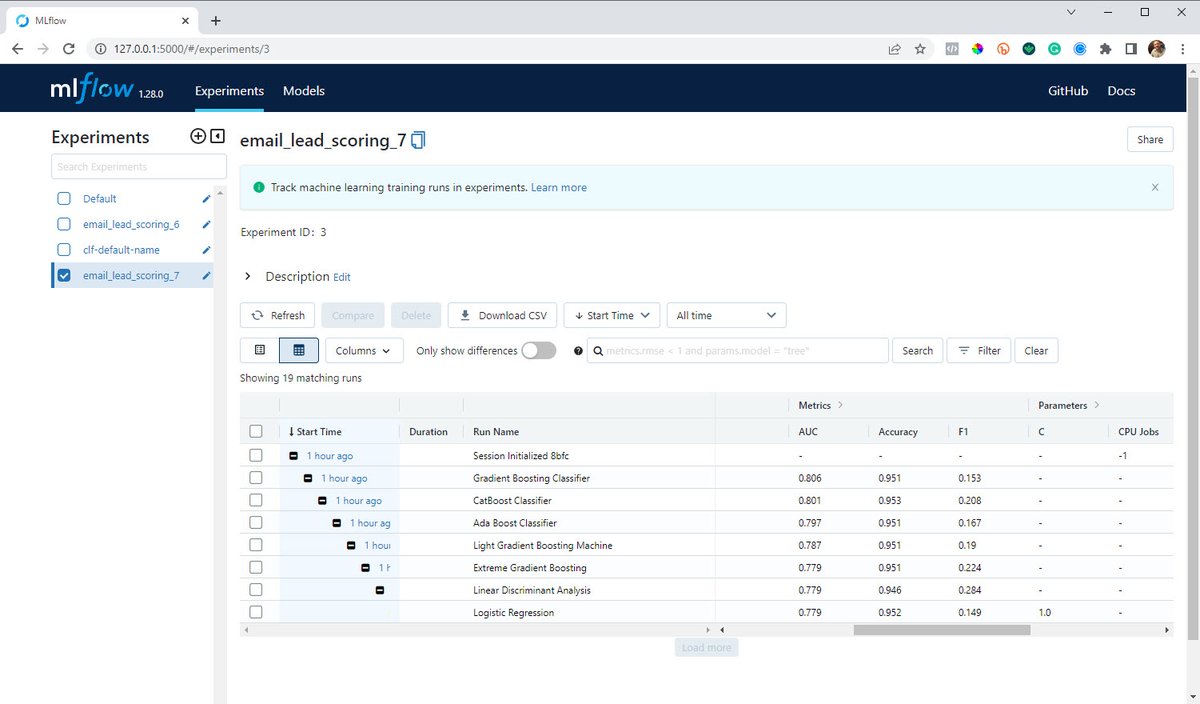
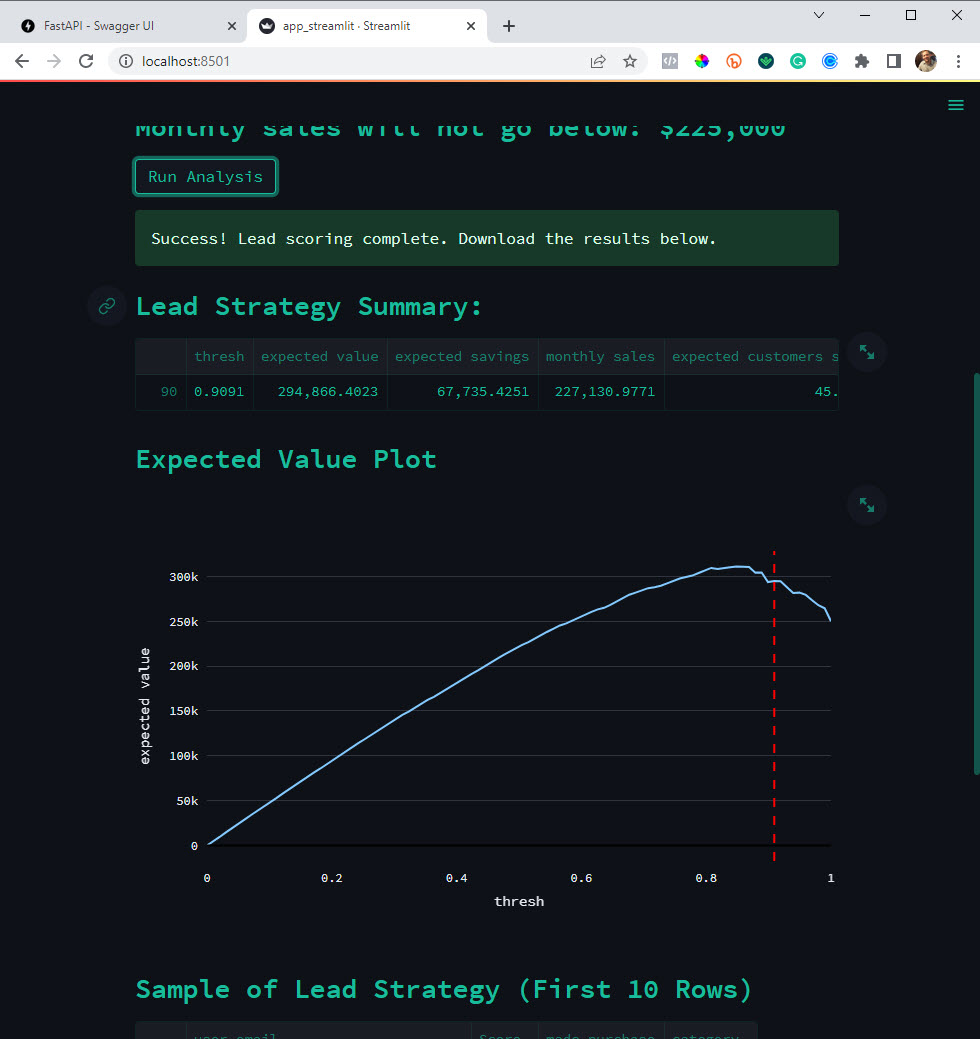
It covers The 6 Top #Python libraries for machine learning and production:
It covers The 6 Top #Python libraries for machine learning and production:


Ready to learn more AND advance your career with Python?
Then you can't miss this event.
$400 in giveaways that everyone gets for attending live!
Then you can't miss this event.
$400 in giveaways that everyone gets for attending live!
What's the next step?
Just join my course waitlist + live launch event here.
I'm super excited!! 😀
👉Register Here: learn.business-science.io/python-ml-apis…
Just join my course waitlist + live launch event here.
I'm super excited!! 😀
👉Register Here: learn.business-science.io/python-ml-apis…

• • •
Missing some Tweet in this thread? You can try to
force a refresh