1/Time is brain! So you don’t have time to struggle w/that stroke alert head CT.
Here’s a #tweetorial to help you with the CT findings in acute stroke.
#medtwitter #FOAMed #FOAMrad #ESOC #medstudent #neurorad #radres #meded #radtwitter #stroke #neurology #neurotwitter
Here’s a #tweetorial to help you with the CT findings in acute stroke.
#medtwitter #FOAMed #FOAMrad #ESOC #medstudent #neurorad #radres #meded #radtwitter #stroke #neurology #neurotwitter
2/CT in acute stroke has 2 main purposes—(1) exclude intracranial hemorrhage (a contraindication to thrombolysis) & (2) exclude other pathologies mimicking acute stroke. However, that doesn’t mean you can’t see other findings that can help you diagnosis a stroke.

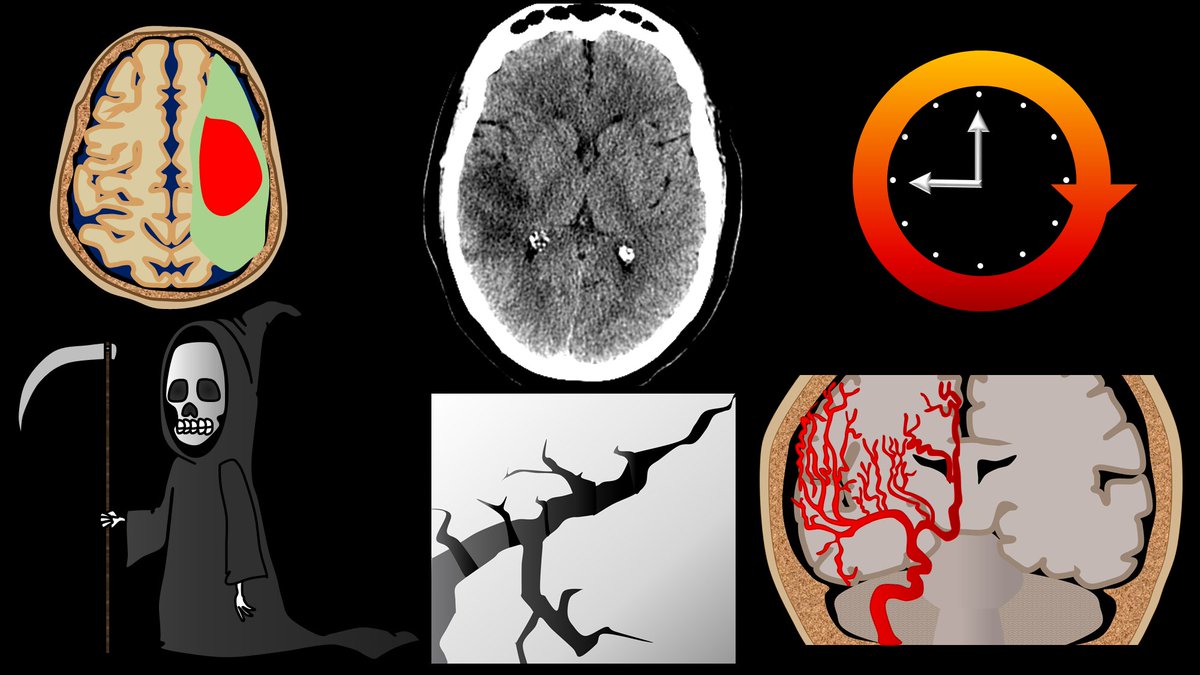
3/Infarct appearance depends on timing. In first 12 hrs, the most common imaging finding is…a normal head CT. However, in some, you see a hyperdense artery or basal ganglia obscuration. Later in the acute period, you see loss of gray white differentiation & sulcal effacement

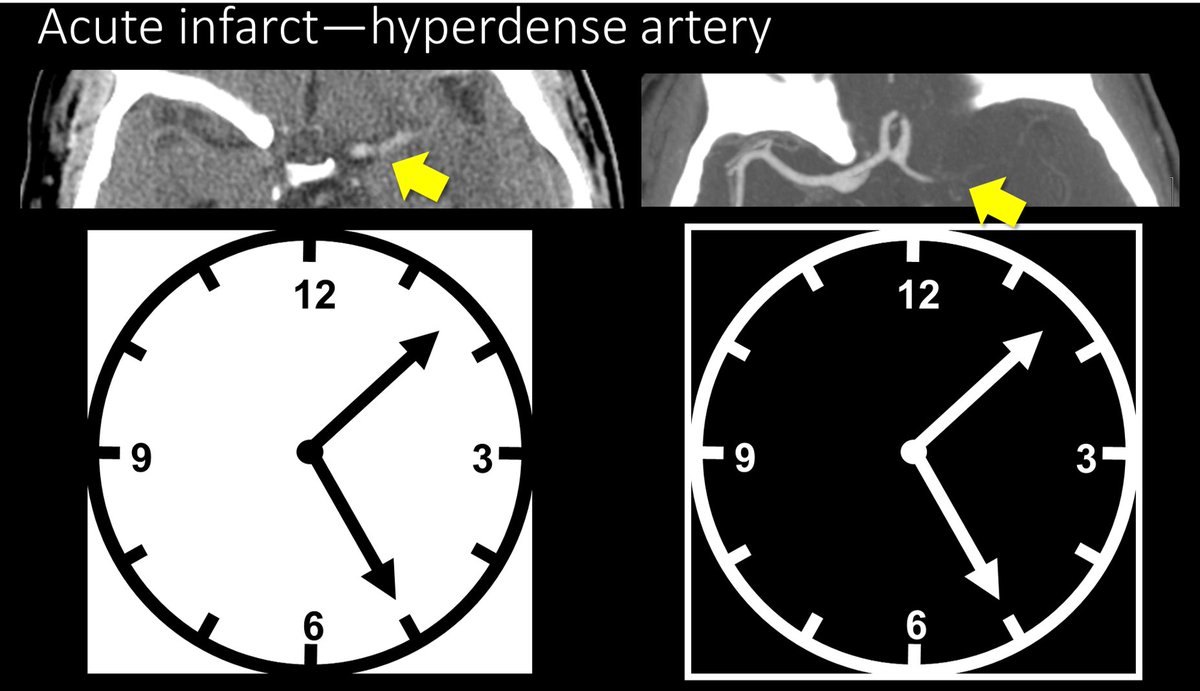
4/Hyperdense artery sign occurs when you see the thrombus in the artery. The thrombus appears hyperdense bc clot is denser than normal flowing blood—& CT is just a measure of density. So an artery filled w/clot will be denser than arteries filled with flowing blood.

5/Bc the hyperdensity you are seeing is clot, there will not be flowing blood in this region on CTA. So the hyperdense artery will be the inverse of the CTA--where there is hyperdensity on non-contrast CT, there will be no density/contrast on CTA—like a negative of a photograph
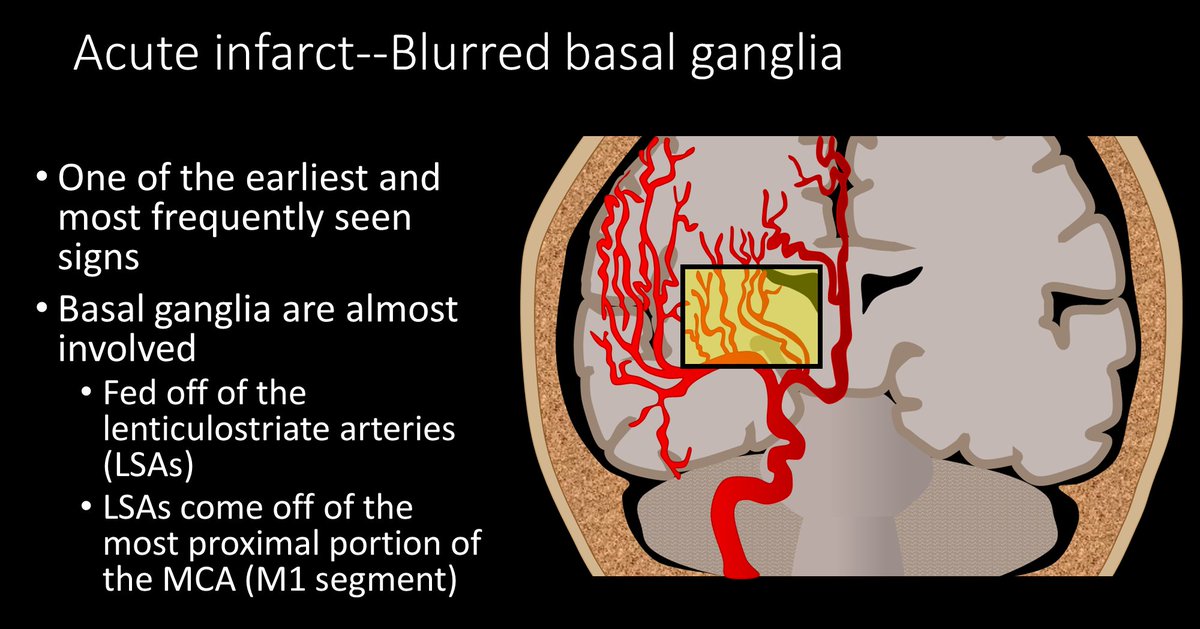
6/The other sign in the first 12 hours is the blurred basal ganglia/lentiform nucleus. Usually this region is a triangle of low density white matter (ant limb internal capsule, post limb internal capsule, external capsule) surrounding the high density lentiform nucleus

7/In an acute infarct, this triangle becomes blurred, as the lentiform nucleus becomes more edematous, it becomes similar in density to white matter. So instead of clean line between white and gray matter, they look like they are smear together.

8/The lentiform nucleus is commonly infarcted bc it receives blood from the lenticulostriate arteries that come off of the M1, so unless there is an occlusion more distal in the MCA, the blood supply to the lentiform nucleus is cut off and it infarcts early.
9/Why do regions become low density when they infarct? This is bc when O2 & ATP run our, Na/K pump stops working & bc of the osmotic gradient, Na & H20 rush into the cell. More water in the cell = lower density. For every 1% increase in H20 there is a 2.5 HU decrease in density

10/This brings us to our next sign—hypodense regions of brain outside the basal ganglia. If the brain is low density, that means it has run out of ATP and swelled, which means the damage is irreversible. Low density = dead brain = poor prognostic sign.

11/Another region that infarcts early is the insula. This is bc the insula is actually an internal watershed in the MCA territory. It is the watershed between the lenticulostriates and the M2 sylvian branches, so it will infarct relatively early with low blood supply

12/Later you will get sulcal effacement. Normally, the brain should have lots of sulci that look like ice cracks/crevasses along its surface. As more water accumulates in the dead cells, more swelling occurs, and these crevasses become effaced by the swollen brain.

13/So now you know the 5 main signs of acute infarct on CT—remember, if you see these five, soon that brain won’t be alive!

• • •
Missing some Tweet in this thread? You can try to
force a refresh