Resilient US Consumer 🧵
1. In April, households saw incomes increase as employment and inflation contributed to nominal incomes. Alongside this increase in employment income, we also saw continued support from income on assets total incomes. Below we show the composition:
1. In April, households saw incomes increase as employment and inflation contributed to nominal incomes. Alongside this increase in employment income, we also saw continued support from income on assets total incomes. Below we show the composition:

2. Personal income increased by 0.36% in April, disappointing consensus expectations of 0.4%. This print contributed to a sequential deceleration in the quarterly trend relative to the yearly trend.
3. The primary drivers of this print were Employee Compensation (0.6%) & Income on Assets (0.25%). Over the last year, Employee Compensation (3.36%), Rental Income (0.5%), & Income on Assets (0.96%). have been the primary sources of the 5.43% growth in income.
4. We zoom into employee compensation to show the industry-wise breakdown of this increase in income. Further, we break these gains down into their macroeconomic drivers, i.e., employment, real wages, hours worked, and inflation.

5. As we can see above, professional and business services continue to be the bastion of the current resilience of the consumer economy. On the other end of the spectrum, financial activities continue to see weakness, especially ex-inflation.
6. It is important to recognize that real incomes this month were weak. Our estimates indicated a -0.10% contraction; official data came up 0.10%. We show the sequential evolution of the data below. We also zoom out to offer more context:


7. Next, as previously alluded to, we show how income on assets continues to contribute to income growth, now contributing 1% of the total 5% growth in nominal income:

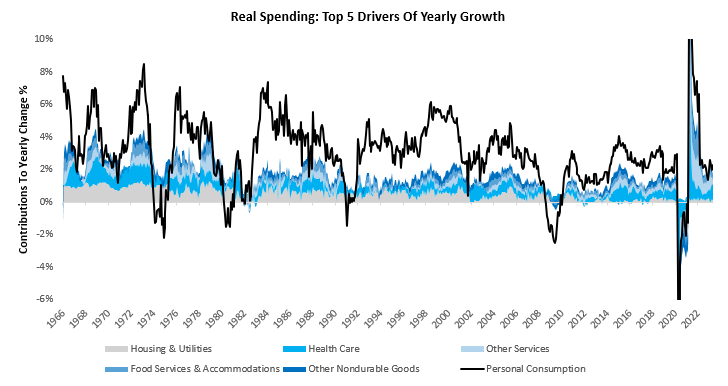
8. This increased income was spent on the economy, with motor vehicles seeing strong nominal and real spending. Nominal consumer spending increased 0.84% in April, surprising consensus expectations of 0.3%.

9. This print contributed to a sequential deceleration in the quarterly trend relative to the yearly trend.
10. We zoom out to show the drivers of current trends in spending. Other Nondurable Goods (0.63%), Housing & Utilities (1.49%), Health Care (1.39%), Food Services & Accommodations (0.65%), & Other Services (0.88%). have been the primary drivers of the 6.73% growth in spending.
11. This increase in spending was a drag on savings, which came alongside a decrease in mortgage borrowing, dragging on total borrowing.Overall, This nominal spending continues a trend that has been in place since last year, i.e., one of declining sustained savings reductions.

12. However, durable goods spending, home prices, and equity market prices came together to create an increase in assets, increasing household net worth.
13. According to our latest estimates for the month of April, household net worth increased by 2.9%, driven by a 2.81% and -0.08% change in assets & liabilities, respectively.
14. We show the evolution of our household net worth estimates below, which show that net worth has contracted -0.97% over the last year:

15. Over the last year, household assets have fallen by -0.97%. Below, we decompose these changes in assets into risk assets (equities, corporate credit, etc.), real assets (real estate, consumer durables, etc.), and cash assets (checking, savings, money markets funds, etc.).

16. Risk assets, real assets, and cash assets have contributed 0.29%, -0.36%, and-0.9%, respectively, to the total change in household assets over the last year.
17. Contemporaneously, household liabilities have grown by 9.73%, driven by a 7.99% rise in mortgages and a 1.73% increase in consumer credit. We show our estimates for both below, along with the official data:

18. Overall, the latest data for April suggests a more resilient consumer, supported by strong employment and income on assets. Employment remains the stronghold of the economy and an offsetting force to weak business conditions.
#consumer #resilient #macro #markets
#consumer #resilient #macro #markets
• • •
Missing some Tweet in this thread? You can try to
force a refresh