1/5 After 11 months of collapse, which took our #US housing activity indicator to its lowest point in over 10 years, it has rebounded for the 6th consecutive month, with 10 out of 15 components up, among which housing starts (+22% m/m !), …
2/5 … homebuilders’ sentiment up 5 points, in expansive territory for the first time in 11 months and median new home price to disposable income ratio which fell 15% since its peak, returning to its >20-year average
3/5 One of the implications of the rebound in our activity indicator is that the residential component of GDP should stop contributing negatively to growth as early as Q3, supporting the idea of a soft landing for the US
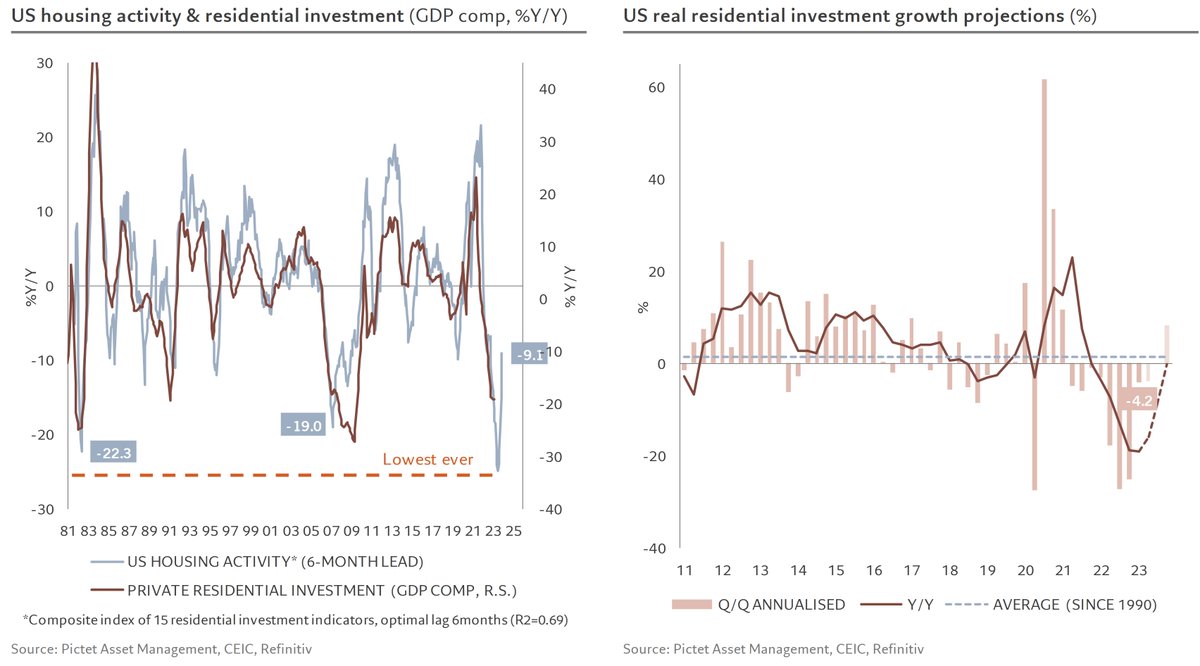
4/5 Another implication is that house prices have likely bottomed out
5/5 All in all, the US residential market has bottomed out, but the rebound should remain contained, with rates for new mortgages still high and debt servicing still at 26% of median income for the purchase of an existing home
• • •
Missing some Tweet in this thread? You can try to
force a refresh
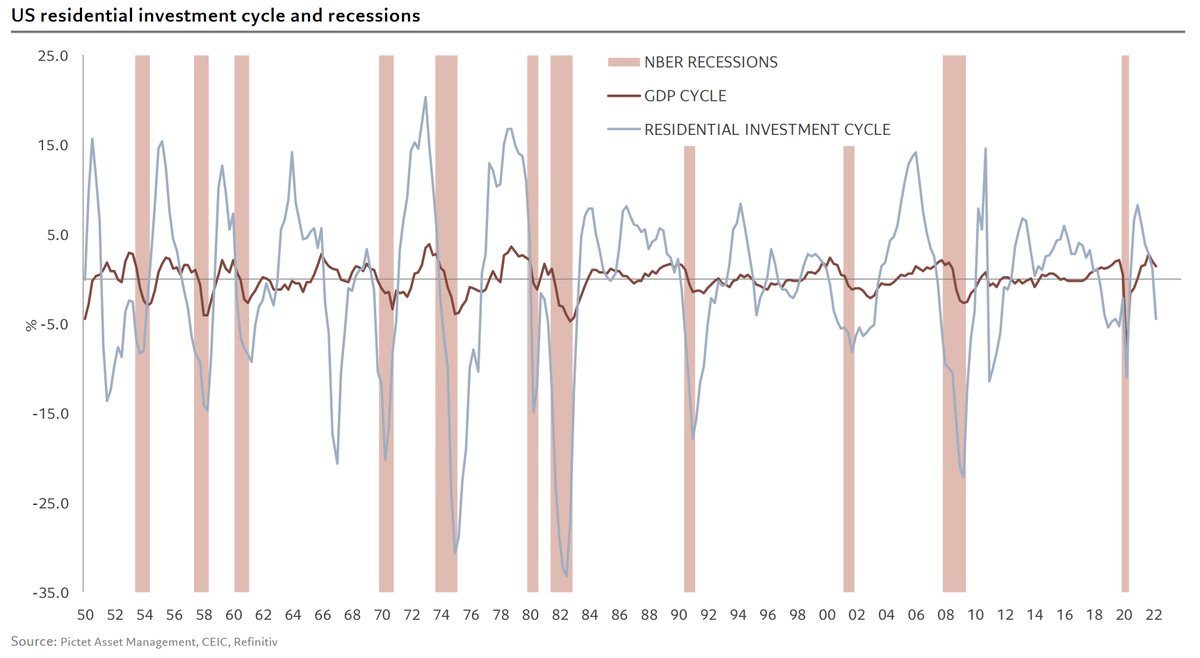
Starting point is the peak of the residential cycle, as it has caused 7 of the 10 past recessions, which are used to compare to the current cycle
The collapse of housing today (-21%) is very similar to that of the previous 7 cycles (-20%)
2/4 On the other hand, as we know, the consumption cycle is not only stronger than the previous cycles, but also stronger than each one individually👇
And without much surprise due to the consumption of services👇
3/4 This can be explained in part by the excess savings accumulated during the pandemic, but also by a labor market that remains super-strong in this cycle: +8% on NFP vs. +1.4% in previous ones 👇with a falling unemployment rate, which has (almost) never happened in the past👇
1/5 After 10 months of decline and for the 3rd month in a row, our #US housing activity indicator has stopped deteriorating with 11 out of 15 indicators up, among which building permits
2/5 Housing was the 1st demand component to turn around in March 2021 and should, as in past cycles, be the first to recover
There are three main reasons for the first signs of recovery in the housing market:
3/5
1) The decline in house prices, which is expected to continue given the historical lag of prices on housing activity. This correction makes homes more affordable as is evident in the decline in the ratio of house prices to disposable income by over 10%
1/5 #China’s activity data for January and February combined confirm the recovery following the reopening of their economy and this recovery is strong starting with retail sales in volume which have increased by more than 6% since December, but still remains 13% below trend
2/5 √ The other very good news comes from the rebound in the real estate market with a strong recovery in both supply and demand for residential space… which is still nearly 30% below its trend though
3/5 √ The rebound in residential demand is in line with i) daily real estate transaction data from 16 major cities ii) a 130bps drop in mortgage rates and iii) much better household confidence
1/ √ US January core CPI inflation came in slightly higher than expectations (+0.5 m/m) with a continued normalisation of goods prices (1.0% y/y) and a continued rise in services prices (7.3%)
2/ √ in terms of momentum, the story is largely unchanged with a contraction in the price of goods (-1.2% 3m/3m ann.) and a continued stickiness on the price of services (+6.9%)
3/ √ The downward resistance is still due to the rise in rents, which accounts for more than 55% of the core CPI services and whose momentum rose slightly further (9.0% 3m/3m ann.). The one-year lag in rents over house prices points to a peak in Q2
1/5 √ US January CPI inflation came in largely in line with expectations (headline +0.5 and core +0.4 m/m) with a continued normalisation of goods prices (1.3% y/y) and a continued rise in services prices (7.2%)
(thread)
2/5 √ In terms of momentum, the story is largely unchanged with a contraction in the price of goods (-1.6% 3m/3m ann.) and a continued stickiness on the price of services (+6.9%)
3/5 √ The downward resistance is still due to the rise in rents, which accounts for more than 55% of the core CPI services and whose momentum seems to be stabilising at a high level (8.9% 3m/3m ann.). The one-year lag in rents over house prices points to a peak in Q2
1/7 #China activity indicators for Nov came in much weaker than expected on Covid-linked restrictions and protests
. Too early for easing property measures to have an impact: floor space started remained at 13-year lows and residential demand is back to new cyclical lows
thread
2/7 . Overall construction activity was unchanged at cyclical lows and 24% below pre-pandemic trend while bottoming out on a y/y basis (-9.3% y/y vs -14.2% in Aug)
3/7 √ #China home prices fell for an 8th consecutive month, down 2.3% y/y, with 23 of cities having rising prices (up from 15% in Oct)