AIUnderPressure Profile picture
The #AIUnderPressure Podcast with @GagsTandon @DanKennett @StatsSwearwords @AnalyseSport @Barts78 from @AnfieldIndexPro
Jan 16, 2023 6 tweets 3 min read
Brighton pod just recorded and out soon. A sad day for us here because we all agreed this is the worst pressing performance we've ever analysed under Klopp.
Thread of images coming up 👇 The intensity, work rate and effort was all there. We tried to roll back the years and do our thing....but the execution was catastrophic
Apr 18, 2022 6 tweets 3 min read
Latest pod now out covering Benfica 2nd leg and Man City SF
Some huge pressing stories in this one and some images of our unique data coming up Mane and Salah have had some huge pressing games in the past but both got their career max against City, 47 for Sadio and 49 for Mo (with 14 possession wins!)
Naby Keita delivered the highest possession adjusted figure we've ever collected, 65.1 !!
Nov 18, 2021 15 tweets 5 min read
With the #EPL returning this weekend, it's time for our look at one of the issues affecting #LFC this season: the effectiveness of our systemic press. We think this is a unique perspective using our in-house pressing data First of all it's worth noting that there are no issues with the intensity or volume of our press. And the production from the press in attack (shots, XG, counter-attacks) has been very good. The issues are on the defensive side, pressers being bypassed and gaps in the chain.
Oct 1, 2021 9 tweets 3 min read
Thread covering our latest podcast discussion on Brentford committing all 10 players at attacking set plays.
What do they know that everyone else (except Midjtylland) doesn't? Let's start with Midjtylland. This was their claimed performance across 4 seasons starting from their first title win in 14/15.
45% of goals from set plays.
0.75 set play goals per game.
This is what they look like compared to EPL teams in last 5 years. Image
Apr 9, 2021 8 tweets 3 min read
Real Madrid pod is out and unsurprisingly there is detailed look at our pressing using our unique data. The narrative that "we didn't press" is wrong. We pressed Real 167 times and the Leipzing first leg was 172. The issue was where and how we pressed. THREAD One of the biggest stories is that Jota playing the centre forward role did not press Kroos once during the entire match. In fact neither Jota or Mane pressed Kroos during the match. Jota and Mane pressed the same people in the same locations (Vasquez, Militao, Modric)
Sep 22, 2020 5 tweets 2 min read
Chelsea podcast recorded and out soon. The most presses we've made in any match for nearly 2 years (260), despite having 61% possession and playing 45 mins with a man advantage. Incredible intensity from the Reds The most impressive thing about our pressing in was the balance of the system. Coming up are 3 pressmaps and look at the symmetry in the left and right halves of the pitch
1. Mo and Mane. Either high, central inside the oppostion box or to the outside of the halfspaces
Sep 20, 2020 7 tweets 2 min read
It's that time of the week.

More Referee stats courtesy of our friends at @URef_Official - please do give them a follow.

Thread to follow! 👇👇

Chelsea V Liverpool
Referee: Paul Tierney
VAR Referee: Michael Oliver Chelsea have a perfect 5 Matches, 5 Wins record under Paul Tierney in the Premier League - 100% Win Rate. Tierney is Chelsea’s best Referee in terms of Win Rate.

Liverpool also have a strong record under Tierney in the Premier League since 2014 - 78% (5th best) - a 7-1-1 record.
Sep 18, 2020 4 tweets 1 min read
We are seriously excited about the Diogo #Jota links. Almost a statistical clone of Sadio Mane at Southampton Image Damn typo. Mane XA should be 0.17, not 0.7
Sep 12, 2020 4 tweets 1 min read
We've been sent some interesting stats by our friends at @URef_Official who use VAR data and the Uref app The league average "VAR Overturn Rate" is 17.8% of decisions.
Paul Tierney is today's VAR Ref and his Overturn Rate is just 9.5%, the 5th lowest of all refs. Tierney rarely overturns the on-field official who today is Michael Oliver.
Jul 31, 2020 12 tweets 3 min read
Thread:
LFC had effectively won the league on Jan 29th after 24 games when we had a 19 point lead (some could argue we had it won earlier than that but there is no argument after GW24) This thread is going to look at the numbers from those first 24 games when LFC were W23 D1 L0 F56 A15. It is going to ignore everything that happened after as inconsequential. All XG data from understat.com
Jun 28, 2020 4 tweets 2 min read
Great question from @CadyJon on Wijnaldum. What makes him so important, does our data tell any stories? Well he presses about 30% less than our all other midfielders which lines up with his on-ball metrics. But one thing we have found is that when Gini presses AS PART OF A CHAIN he is one of the strongest in the team and significantly better than the other midfielders except Ox. This data is all comps from the start of last season Image
Jun 10, 2020 10 tweets 5 min read
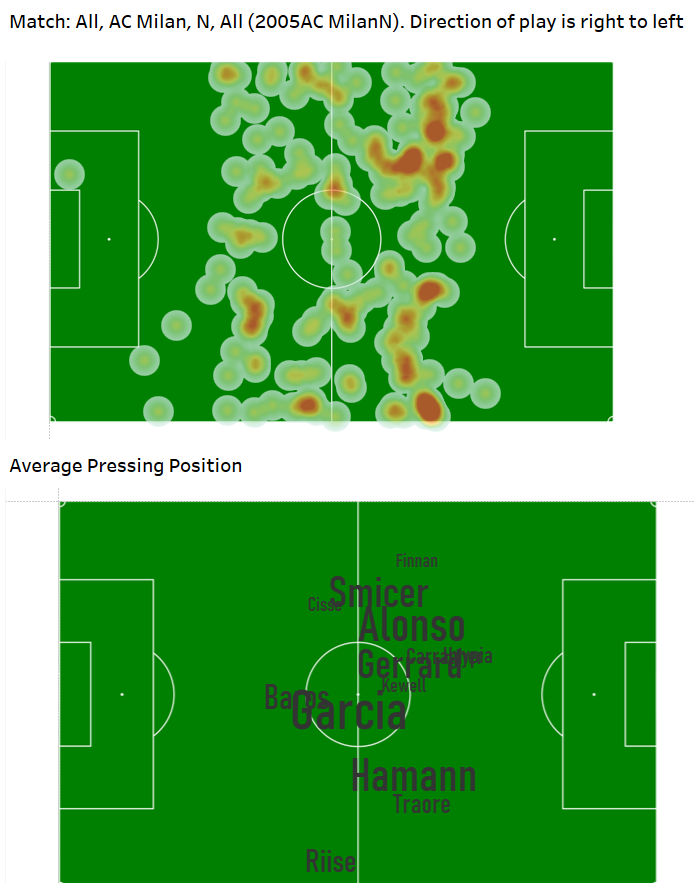
In our latest pod we go back to *that* match in Istanbul. Coming up is some our analysis of that match using our unique data. For much more, join our discord channel anfieldindex.com/join First of all the pressing heatmap and average positions. Very deep and very defensive in nature, with red splodges right across the defensive line Image
May 14, 2020 7 tweets 3 min read
Our latest UP Rewind is LFC 4 BVB 3 from April 2016. You can watch the whole match again in full, for free, on UEFA TV links.uefa.tv/UEL-VOD-Liverp… We were already collecting pressing data in Klopp's first season but only in the EPL, this was a great chance to do one of our missing matches against a top European opponent. What we found wasn't pretty Image
Apr 29, 2020 4 tweets 2 min read
Almost 900 votes and 42% went for Hendo but the answer was....Phil Coutinho. Here's Phil pressmap for that match, it's the only one that bears any resemblance at all to what we have become used to under Klopp. 8 possession wins as well which is also objectively good Image One enormous diffference to today was an almost complete absence of pressing chains. There was no systemic co-ordination, no traps and no triggers. The longest chain was just THREE and that was all the same player! Image
Feb 17, 2020 5 tweets 2 min read
The Times are reporting that #lfc had the most final third recoveries in 10 years against Norwich. Here's what that looks like with the opta data Image And here's what that looks like with our unique pressing data.
We've only seen a couple of matches where the whole pressing heatmap has been this high up the pitch. Image
Jan 1, 2020 13 tweets 3 min read
A thread of some team and individual highlights from 2019 using our unique data 1. Team: Most presses in a patch:
242 vs Barcelona (H) 7th May (43% possession) Image
Dec 19, 2019 6 tweets 2 min read
Using our unique data, here's a visualisation of our pressing evolution under Klopp.
Direct of play is right to left
On left is when game is level, on right when leading
Top images are 2016/17, bottom are 2019/20 #lfc Image You can see how the team has become more practiced and drilled in how it presses. The first 2 full years are all over the pitch and no real differences based on game state.
Dec 10, 2019 5 tweets 1 min read
A look at player pressing since the start of 2018/19 using our unique data:
1. Possession wins p90
7.0 Keita
6.6 Fabinho
6.0 Ox
5.3 Firmino
4.9 Lallana
4.7 Hendo
Everyone else 4 or less 2. Presses p90 (Possession Adjusted)
41.0 Keita
37.6 Ox
35.1 Firmino
34.7 Fabinho
31.7 Lallana
30.0 Milner
29.6 Hendo
Everyone else 27 or less
Dec 2, 2019 4 tweets 2 min read
A couple of standout performances in our latest pod as pressing returns with a vengeance! Bobby Firmino pressmap vs Brighton.
46.8 possession adjusted (best by any player in any match this season)
11 group presses (2nd most by any player after Bobby vs Napoli)
7 possession wins Image
Nov 25, 2019 5 tweets 2 min read
After the Palace review on the latest pod we do a mini season-so-far review. One thing covered is a look at the trends in our unique pressing data First chart is the rolling 6 match group pressing trend, we're currently at our lowest levels since the start of 2017/18 Image
Nov 13, 2019 4 tweets 2 min read
Something else we discuss at length on the pod is City's attacking buildup. They completed 17/21 dribbles, with 14 in the final 3rd, 10 inside the box and 9 in the channel between Trent and Lovren. We've never seen a dribbles map like this before. Image In that context it's testament to our defending that we managed to block so many shots, not foul a city player in the box and clear so many cutbacks. Obviously a chunk of good luck in there as well.