
Investor & Trader | Trading Coach & Mentor | Coaching For Success |
Educational Posts On #Stockmarket | #Investing | #Psychology | SEBI Unregistered |
 MCX >85% market share in commodity trading.
 Textile Theme🧵 🇮🇳
 Risk Management Simplified📔
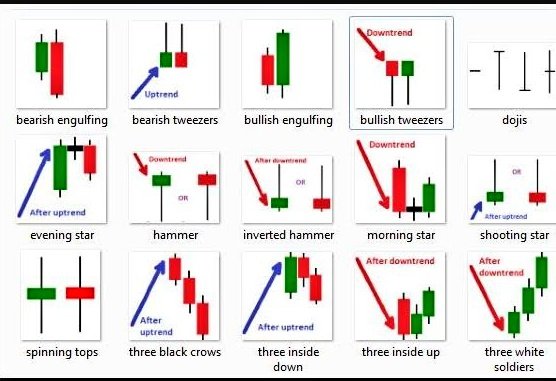
 Price Patterns Simplified📒
 Rural India Theme 🇮🇳
 🇮🇳 Agriculture theme🌾
 Agrochemicals🧪🌱
 Agriculture theme🌾
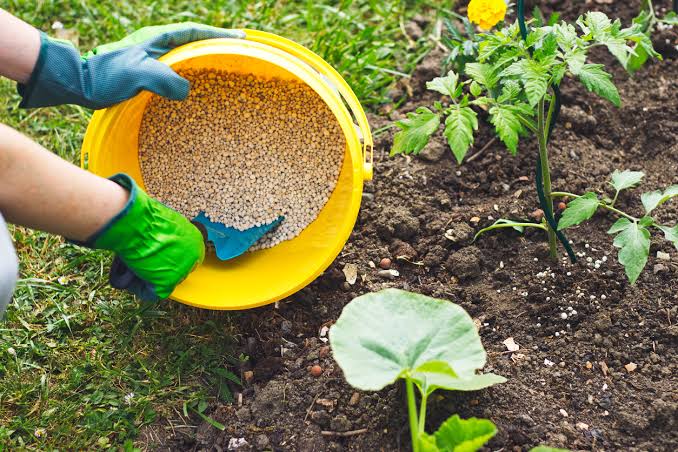
 Agriculture theme 🌾
 But he secretly requested Lord Shiva not to agree to these Farmers & when Farmers reached Lord Shiva he repeated the same thing that he will play Damru after 12 years.
 Price Patterns Simplified📒
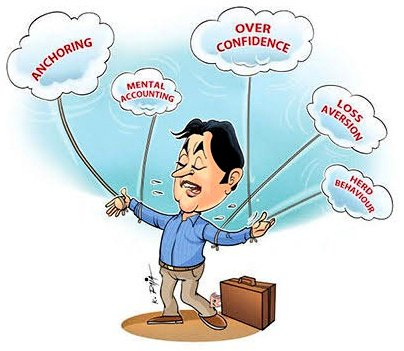 Behavioral Finance Simplified📒
 Reversal Patterns Simplified📒
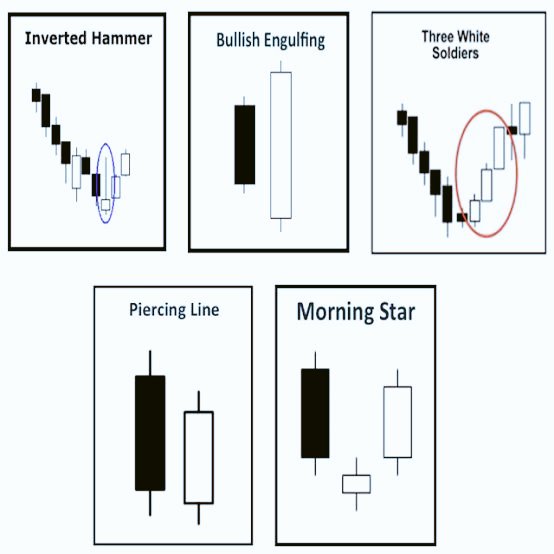
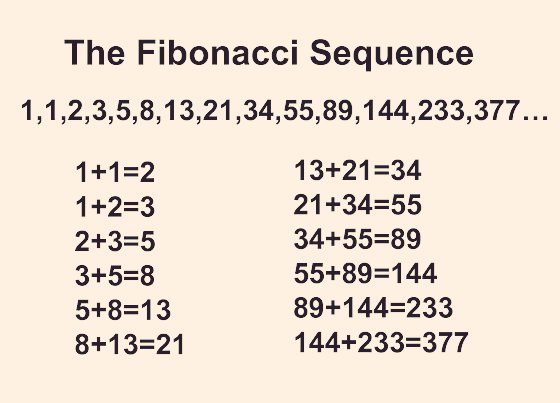 Fibonacci Simplified📒
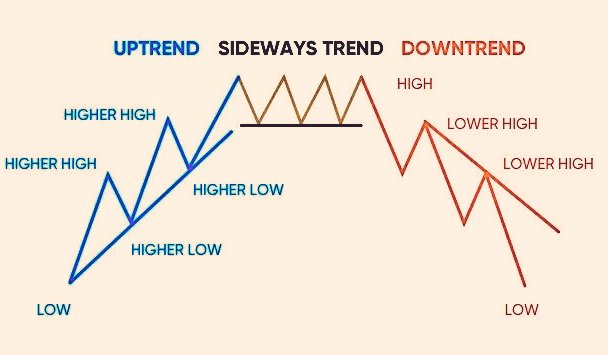 Trend Line Simplified📒
 Ichimoku System Simplified📒
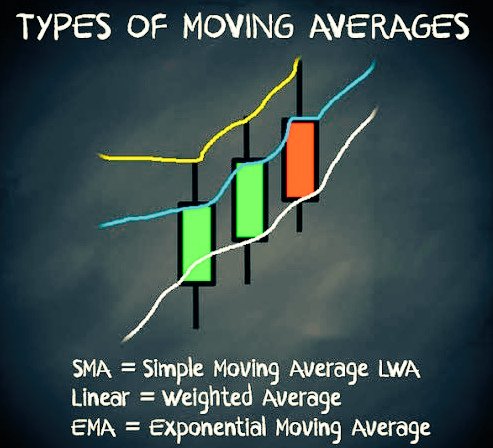 Moving Averages Simplified📒
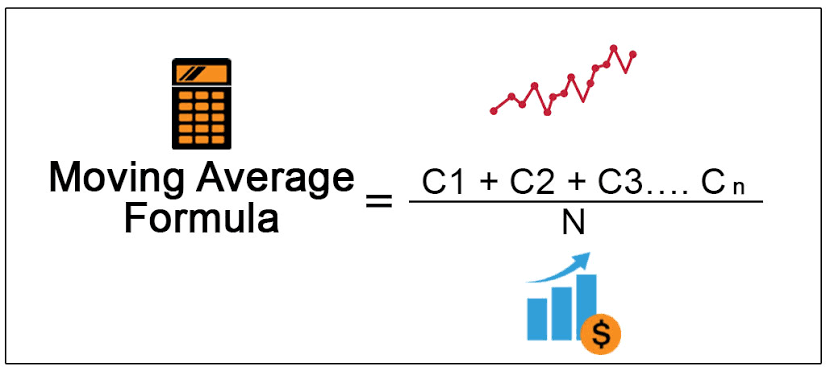
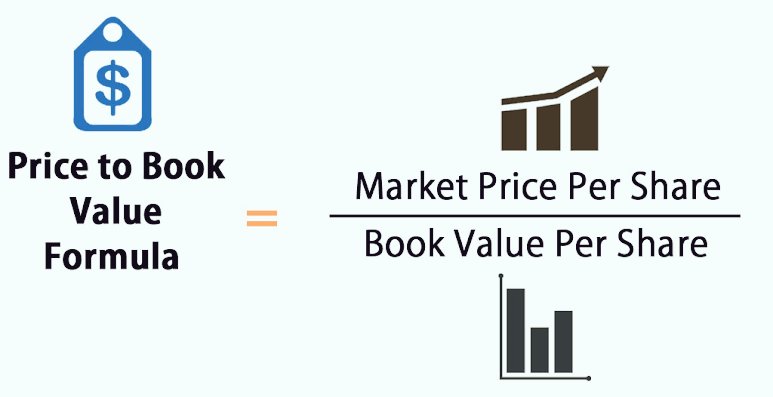 BV & PBR Simplified📒
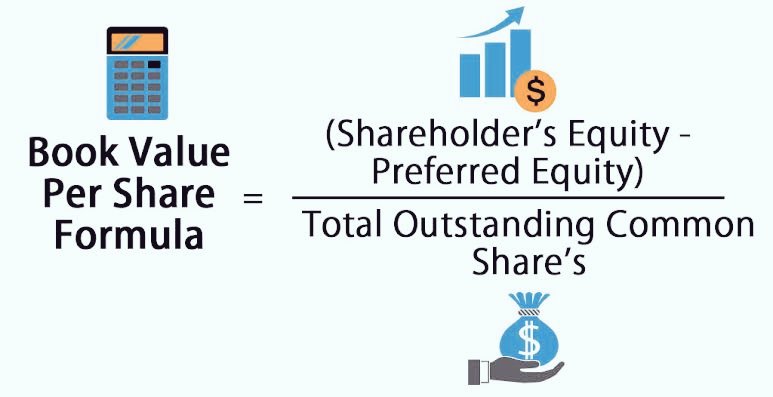
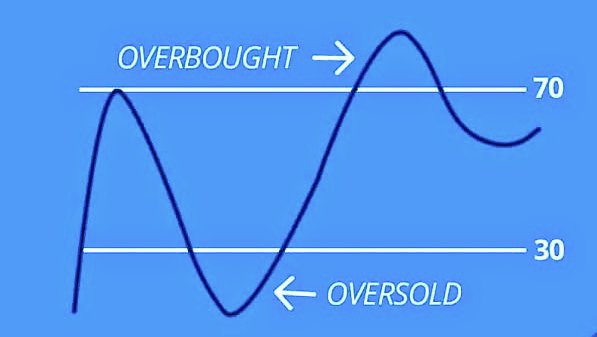 RSI Simplified📒
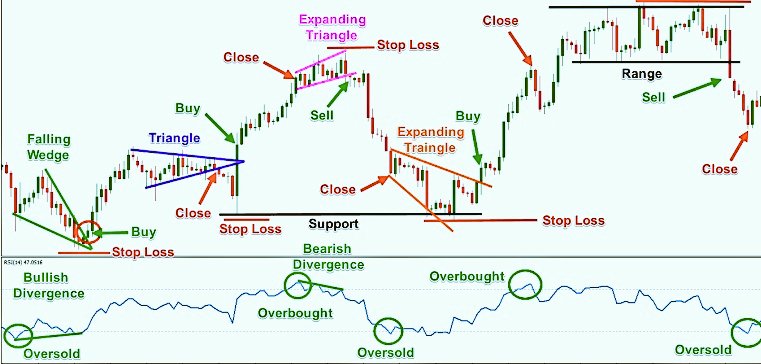
 PE Ratio Simplified📒