Olivia Vane Profile picture
Data visualisation design + code | Interactive data journalist @TheEconomist | Prev. @LivingwMachines at @BritishLibrary @TuringInst | #dataViz PhD @RCA
Feb 22, 2021 6 tweets 4 min read
Voting for the #DigitalHumanities Awards @dhawards is open 🥁🥁🥁

'Press Picker', developed by @kasra_hosseini @giorgiatolfo and I as part of @LivingwMachines is up for ‘Best DH Data Visualization’

livingwithmachines.ac.uk/press-picker-v… Newspaper history almost conspires to be difficult data eg. titles changing their name through time
Feb 17, 2021 11 tweets 8 min read
I’ve shared a collection of 4 @observablehq notebooks about drawing and animating 'waterlines'—an old technique for showing water in maps—in JavaScript

Old + new #dataviz #maps mash-up: a thread

observablehq.com/collection/@ol… 
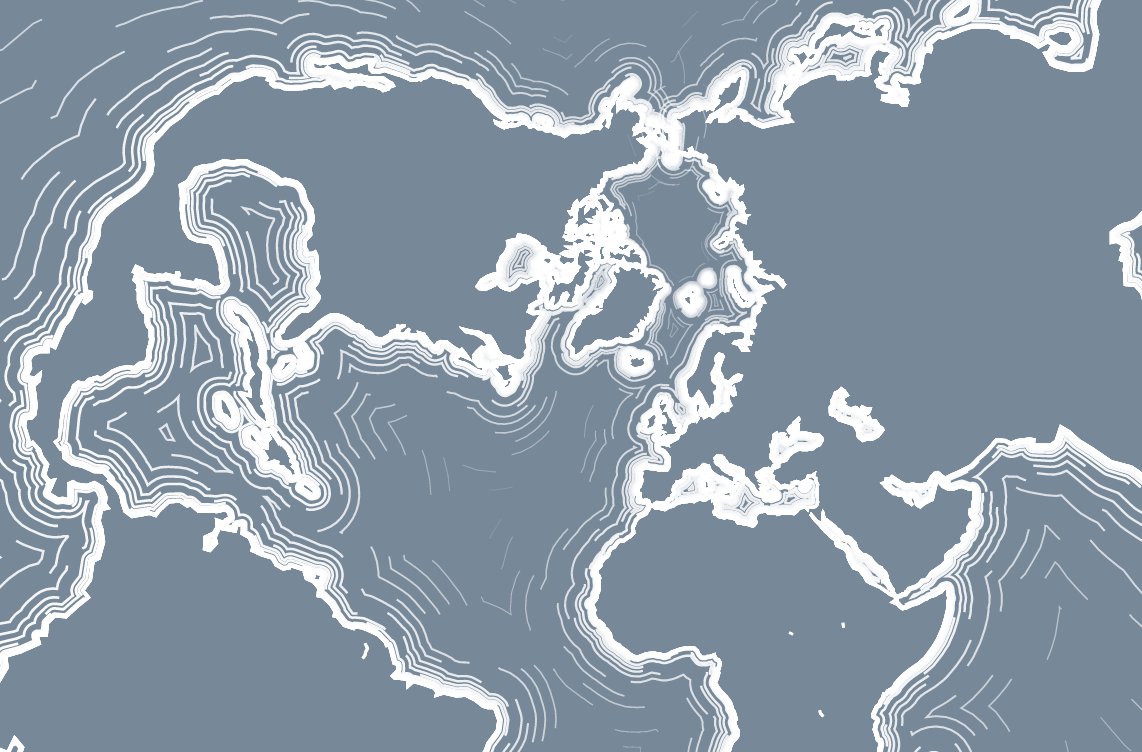
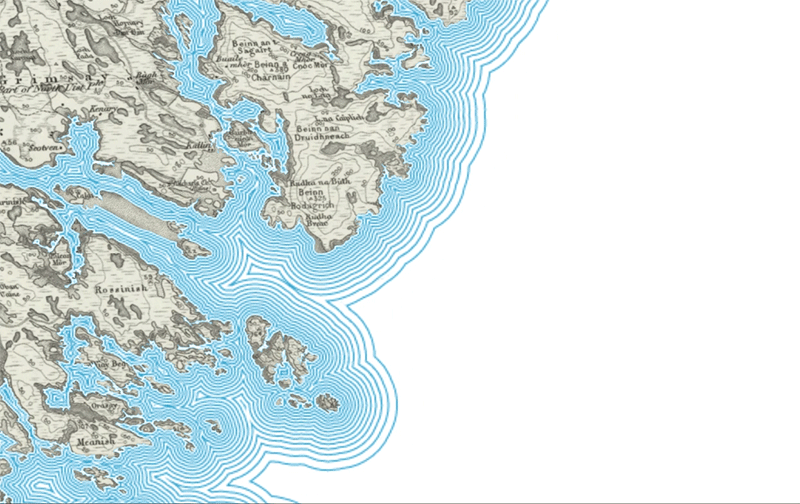
Waterlines are a beautiful feature of western 19th Century maps – ripples or waves radiating out from the coastline

maps.nls.uk/view/101169311

gallica.bnf.fr/ark:/12148/btv…