Stef @wikisteff@mastodon.social Christensen Profile picture
Ph.D. in AI. Sr. Foresight Analyst, Horizons. Coder, numbers whiz, foresight expert. Sworn to use Evil powers only for Good. He/they. @wikisteff@mastodon.social
Nancy J. Smyth, PhD, LCSW - covid aware Profile picture 1 subscribed
Feb 22, 2023 9 tweets 6 min read
I'm so proud to talk about this paper, Exploring Change in Social Connections. It's about how our social connections are changing, and how they may change further in future with new technologies. What's in here?
First up, how artificial intelligence, including large language models, will be used to detect, recognize, and interpret our emotion and communication patterns. This might alter the way we connect socially, and what emotion and expression mean. #AI #emotionalAI
Jan 31, 2023 16 tweets 8 min read
@nathaliejacoby1 Everyone answered already, but here goes:
1. Masks were heavily advised against here in Ontario, and in other jurisdictions, very early on in the pandemic, when people were paying attention and learning about this new disease.
That stuck. @nathaliejacoby1 2. They are an unmitigated cost to households. No one is making them free, so uptake is low.

3. Trump and others came out early against masking as an effective tool.
Nov 24, 2022 8 tweets 8 min read
@lovemoz1 @EcologicalLimit @LauraMiers Hey, folks!
Great question!

The infectiousness distribution is from "The unmitigated profile of COVID-19 infectiousness", Sender et. al, 2022, elifesciences.org/articles/79134 @lovemoz1 @EcologicalLimit @LauraMiers That's the generation interval of COVID, the length of time from one infection to the next infection.
Nov 24, 2022 15 tweets 10 min read
@LauraMiers So many folks don't know that
(a) infectiousness is very high on Day 1;
(b) symptoms generally manifest on Days 2, 3, 4; and
(c) RAT sensitivity doesn't pick up until Days 5, 6, 7, and you have to test correctly (mouth, cheeks, throat) and repeatedly. Image @LauraMiers Update: after much, much pushback on this chart (and a lot of retweets), I looked much more carefully and with updated data at what we know about COVID's infectiousness, and at RAT's sensitivity curves.
Here's my revised version of that chart: Image
Nov 9, 2022 5 tweets 3 min read
@avantgame Hey, Jane!

There's no question but that masking and isolation destroyed influenza worldwide and locally.
Influenza B is extinct in Ontario; influenza A only came back after masking declined in February-April 2022. @avantgame RSV appears to care more about lockdowns, at least here in Ontario, achieving a test positivity rate of almost 20% at the same time as the Omicron megawave hit in December 2021.
Second graph is the retail consumer volume in Toronto from the Avison Young Vitality Index.
Nov 7, 2022 5 tweets 2 min read
@zalaly Hello!

I made a chart of the dose-response data from Outcomes of SARS-CoV-2 Reinfection, but I noticed that the sample size of the higher reinfection groups is smaller than the first infection.

I was wondering if you were working on a follow-up paper with newer data? Image @zalaly I suspect that sadly the number of people with COVID reinfections in your sample has likely grown quite a bit since this cohort, and I view the question of whether risk increases quadratically or linearly across multiple infections as the most important research question today.
Nov 4, 2022 13 tweets 7 min read
Multinational science Delphi:
- #COVID is airborne (100%);
- indoor areas drive transmission (100%);
- N95 masks help (96%);
- public health pushes false info by denying airborne (90%);
- vax alone can't end COVID (97%);
- false info undermines social cohesion for response (99%) - endemic disease does not mean lower virulence (96%);
- individual, voluntary measures will not end COVID (96%);
- infection rates increase when gov'ts relax control measures (94%);
- most countries have not protected children from COVID infection (94%);
Oct 10, 2022 20 tweets 10 min read
This is a fun exercise!

I did the same thing, evaluating this statement. First, I need an operational definition of "full of COVID". I used a bar that I went to on St. Patrick's Day, just after the COVID mask mandate was removed in Ontario.
Apr 29, 2022 7 tweets 2 min read
I admit that I'm deeply concerned about the information asymmetry at play in this phase of the pandemic.

Mathematically, it's bonkers to eat indoors in high season.
I ran the numbers for an indoor eating area with 50 people, and my family comes away with a 42% chance of COVID. Biden knows this, so avoids it. It's game theory.

It's not wise to be indoors with a large crowd of people talking with many of them unmasked, or wearing using surgical masks.
Fauci knows this, so he doesn't go.
Again, game theory: the expected risk outweighs the reward.
Mar 13, 2022 8 tweets 3 min read
Some general observations about COVID after listening to @checkupcbc's phone-in:

1. We're asking WAAAAAAAY too much of doctors.
Doctors have a 4-year degree + residency. We are asking them to be simultaneous experts in virology, epidemiology, statistics, and their own field. @checkupcbc ...doctors are also often asked to be experts in national and provincial policies, foresight, and a host of more specific specialities (suicidology, evolutionary biology, international relations, aerosol chemistry, medical geography, and political science to name a few).
Mar 12, 2022 21 tweets 8 min read
This is an interesting graph.

First, it is actually the fusion of four different curves, one for Wuhan-1, one for Alpha, one for Delta, and one for Omicron. Here are the distributions of UK waves from covariants.org over time. Gray is Wuhan-1; orange is EU-1; red is Alpha; green is Delta; and purple is Omicron.
Oct 20, 2020 4 tweets 1 min read
TFW your AI is better at casting shade than you are. I asked GPT-3 to generate a list of ways to tell someone that they are wrong. Then I scored each of the 200+ answers, and started a second run with only the best of the first run.
It came up with some excellent examples.
May 2, 2018 10 tweets 3 min read
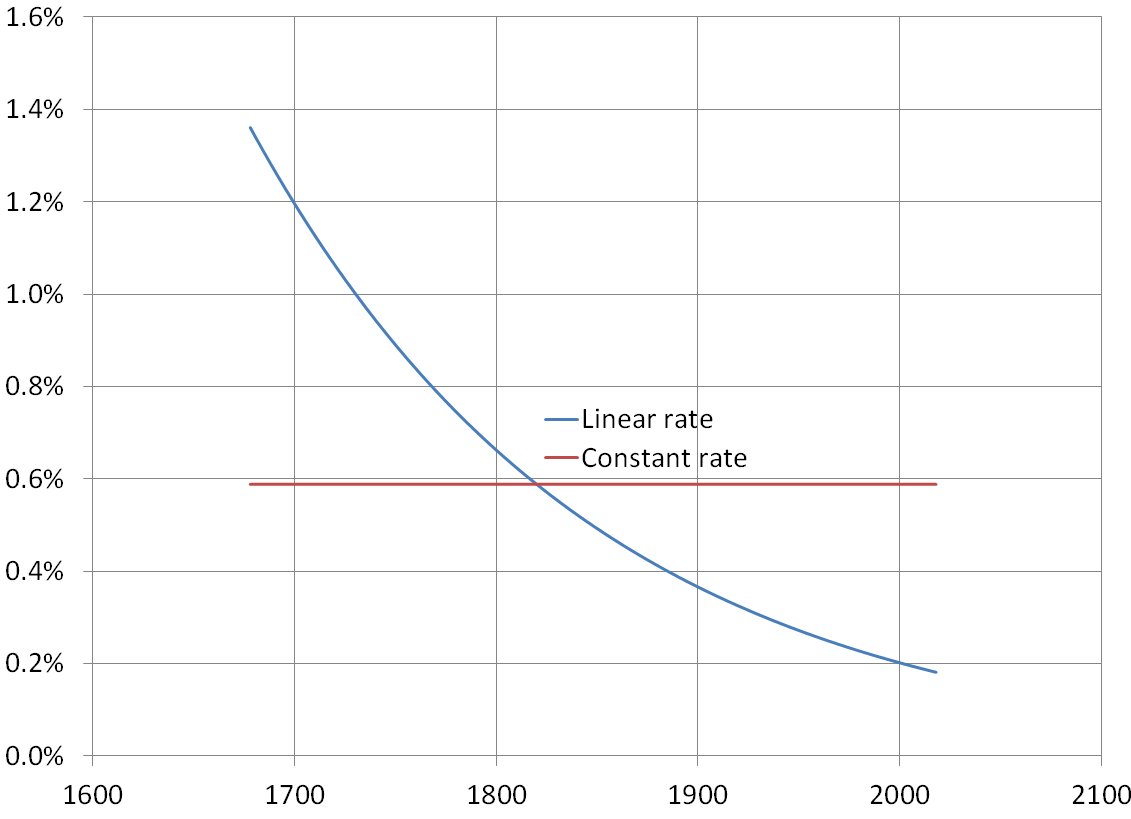
Okay, I picked out the invalid assumption before the paragraph, "It's noticeably bigger."
See if you can! :) #foresight #futurist The answer is, of course, the assumption of stationarity.
Stationarily means, in this context, that rates don't change over time.
Under the model of stationarity, the odds per year of a violent revolution in the 1800s is identical to the odds this year.