
Animal Scientist. Interested in sustainability & the intersection of agriculture & the environment, among other things. Views my own.
 This work relied on the cooperation of over 2000 cattle producers across the USA generously providing information to populate a computer simulation model known as the Integrated Farm Systems Model. IFSM was then used to generate inventories needed for a cradle-to-farm gate LCA

 Regional distribution of beef cows (just the females having calves) on Jan. 1st this year. The state of Texas alone was home to over 14% of the beef cow herd. This is why if drought affects TX or the Great Plains, it impacts the whole beef industry.
 The 31.7 million beef cows in the US in 2017 were spread out in all 50 states, but higher densities found in areas with more pasture/grassland. Intermountain western US has lower density of cows as grazing land supports fewer cows/acre.
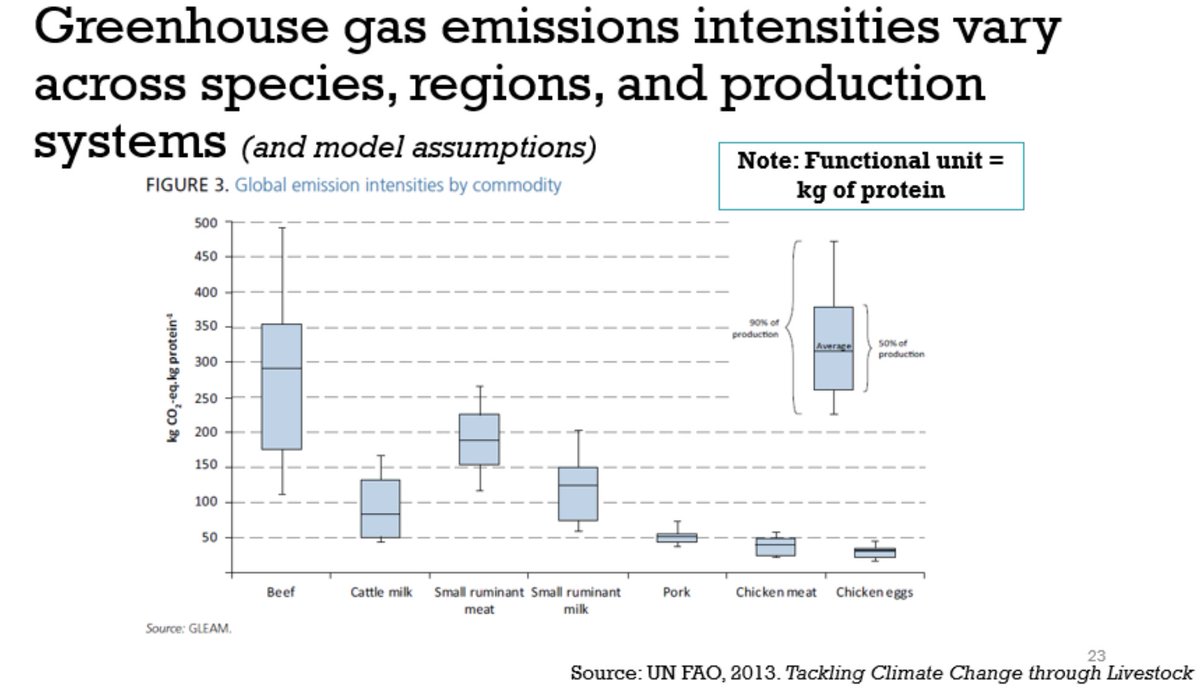
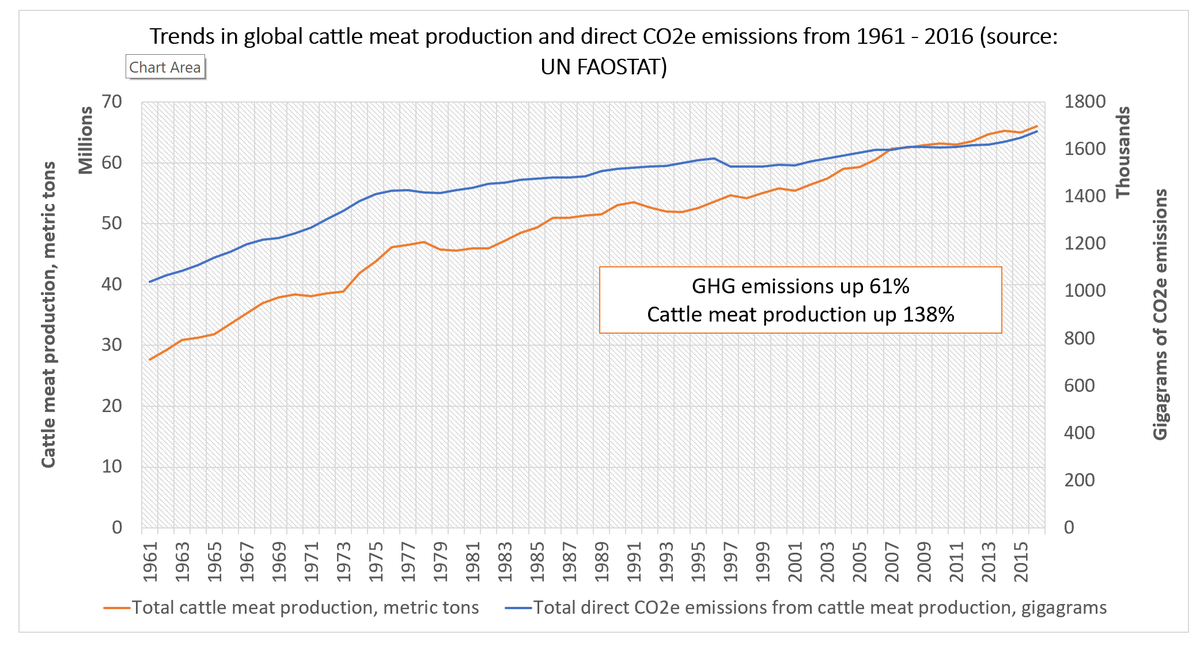 GHG emissions didn't grow as much as beef production because the emissions intensity of beef (kg CO2 equivalent emissions/kg beef) went down 32%. However, this global average emissions intensity masks considerable regional variation.
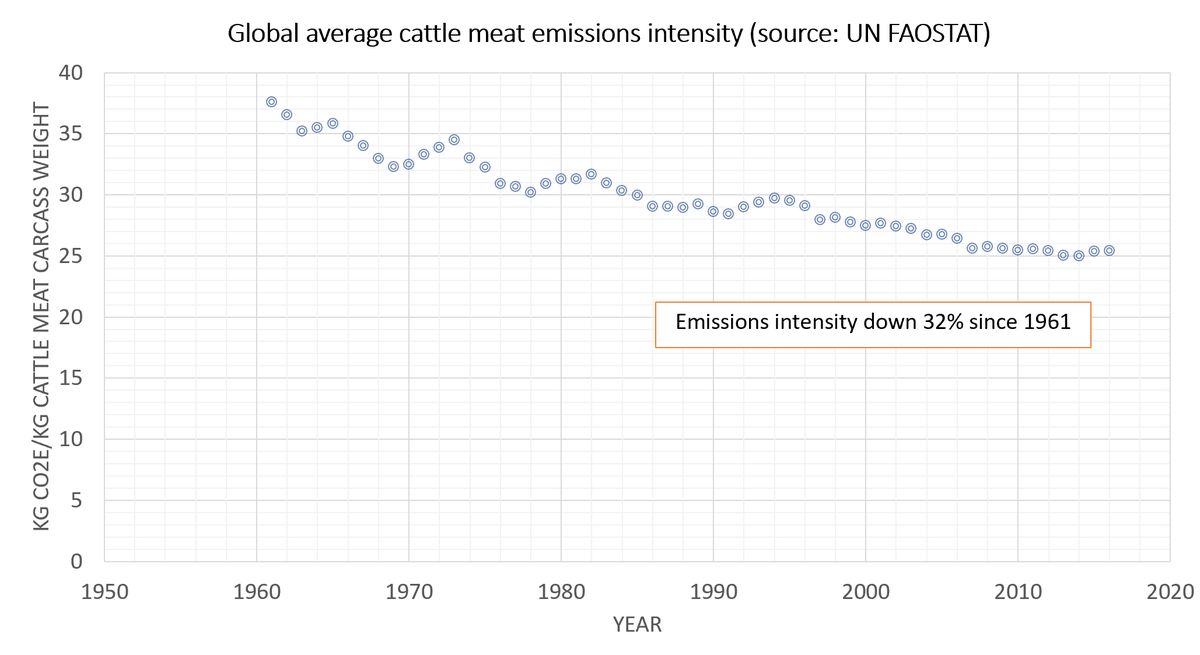
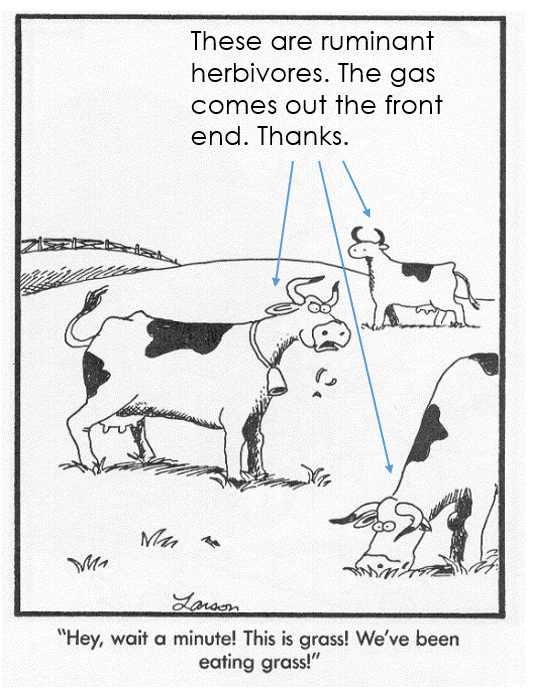 You can classify animals by the digestive anatomy & the type of diet animals consume (typically consume, as there are plenty of examples of "herbivores" occasionally eating animal sourced foods). Anatomy can be things like stomach structure & where most fermentation takes place
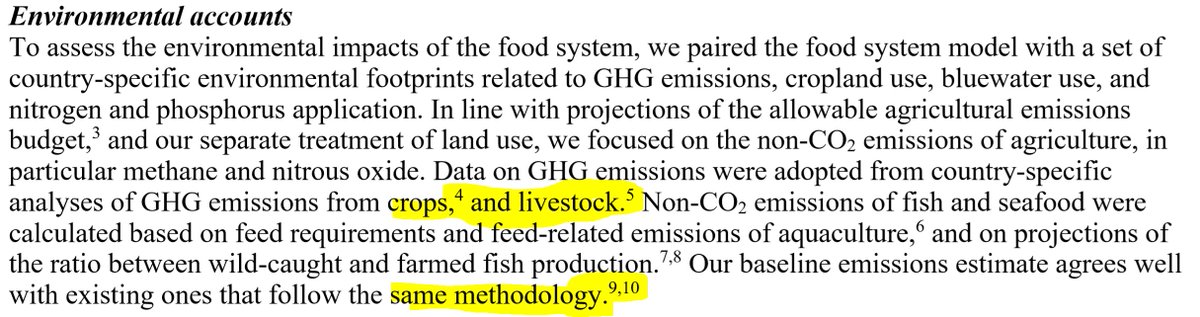 But, if you check references 4,5,9, and 10 in supplementary appendix, no way those refs are referring to this information.
 Here's a UK specific example using nutrient density as the functional unit where beef has a lower carbon footprint than chicken.