J Auto Trading Strategies, LLC
Think It 》Trade It 》Automate It
JATS: https://t.co/OFhHcSykxq
NT Vendor Affiliate
Disclosure: https://t.co/ZNROC7VB7x
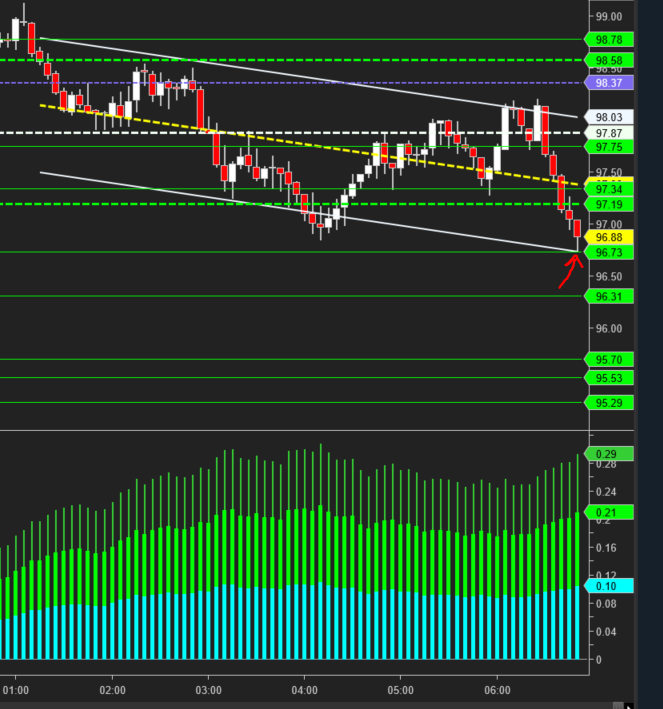
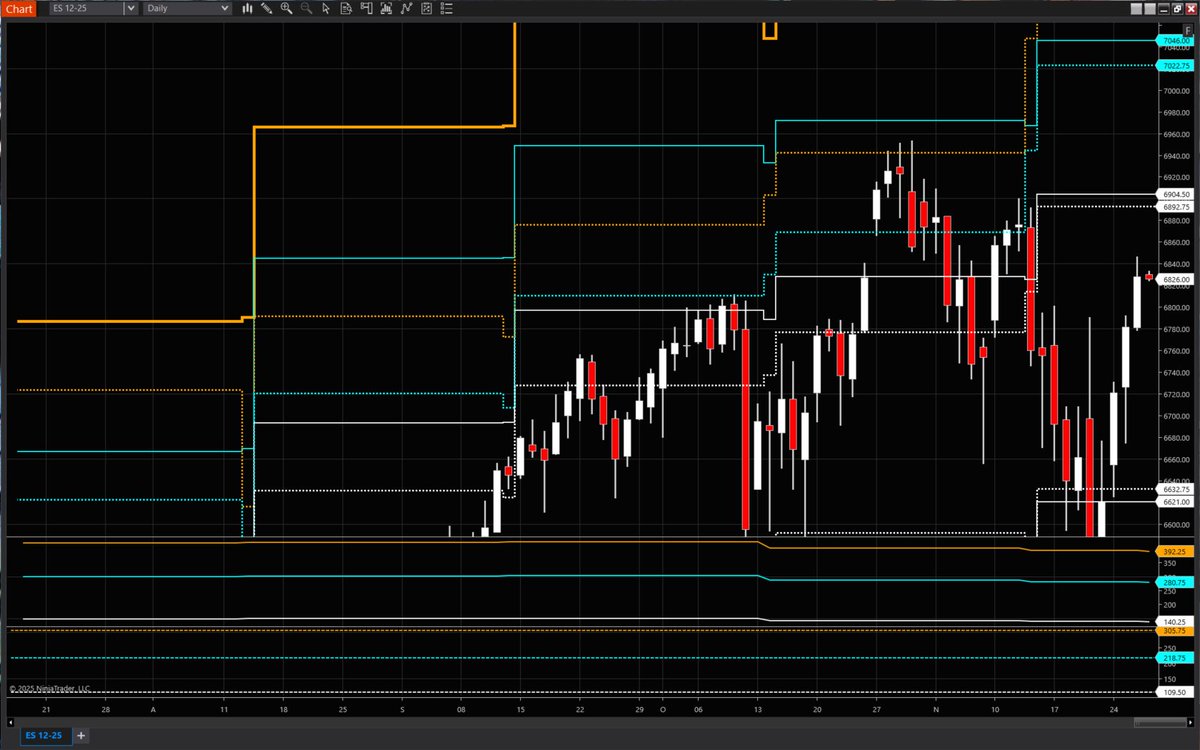
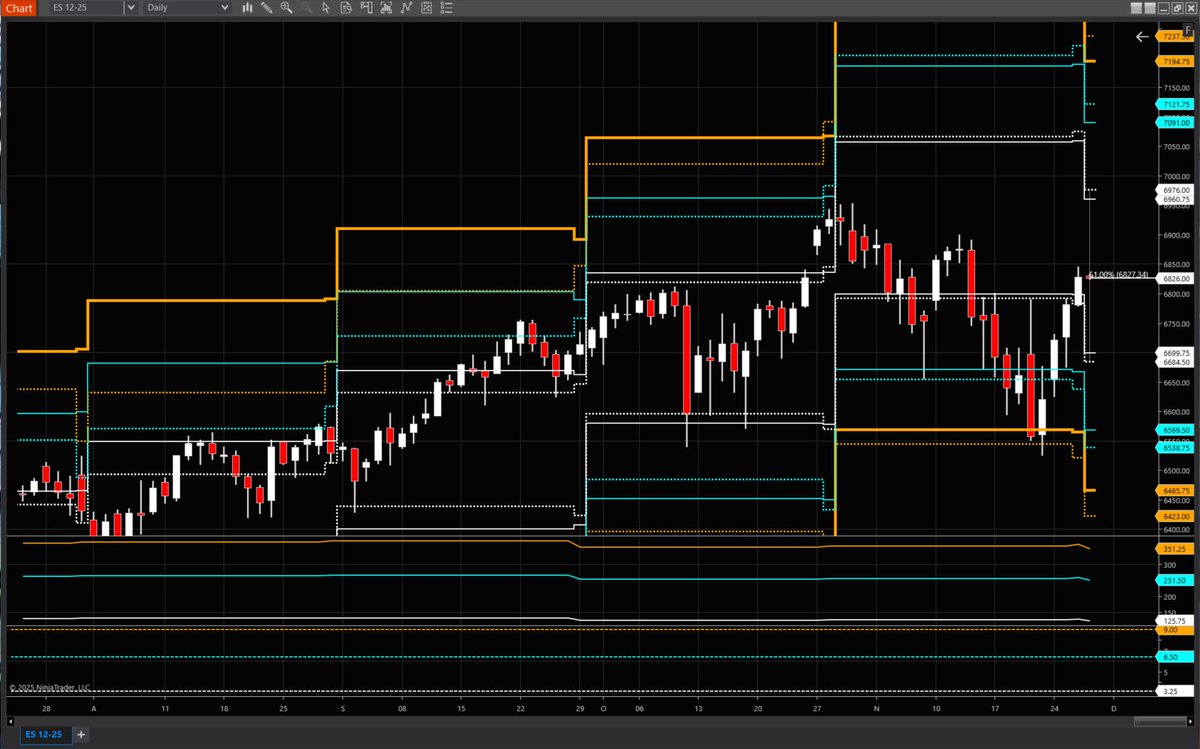
 @zerohedge Example of them going short below the 100 Day distribution. Clear as a bell. Crystal clear.
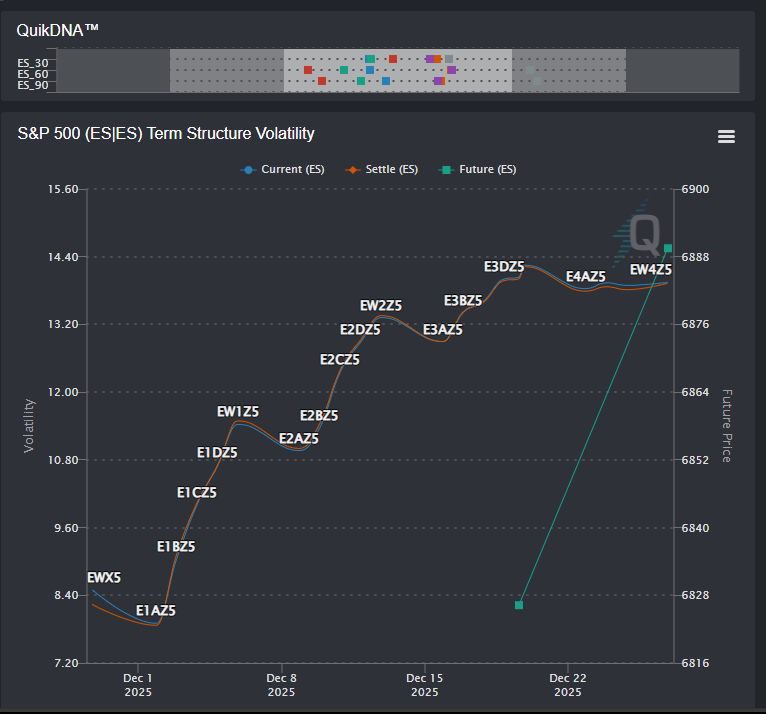
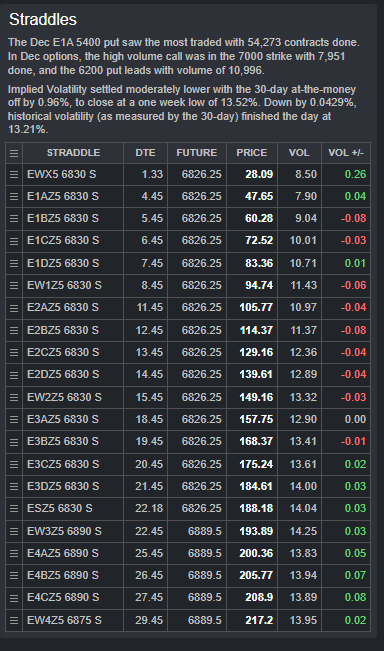 Navigating Year-End Volatility: S&P 500 (ES) Futures Outlook to 7,000 -- November 27, 2025 -- 22 DTE


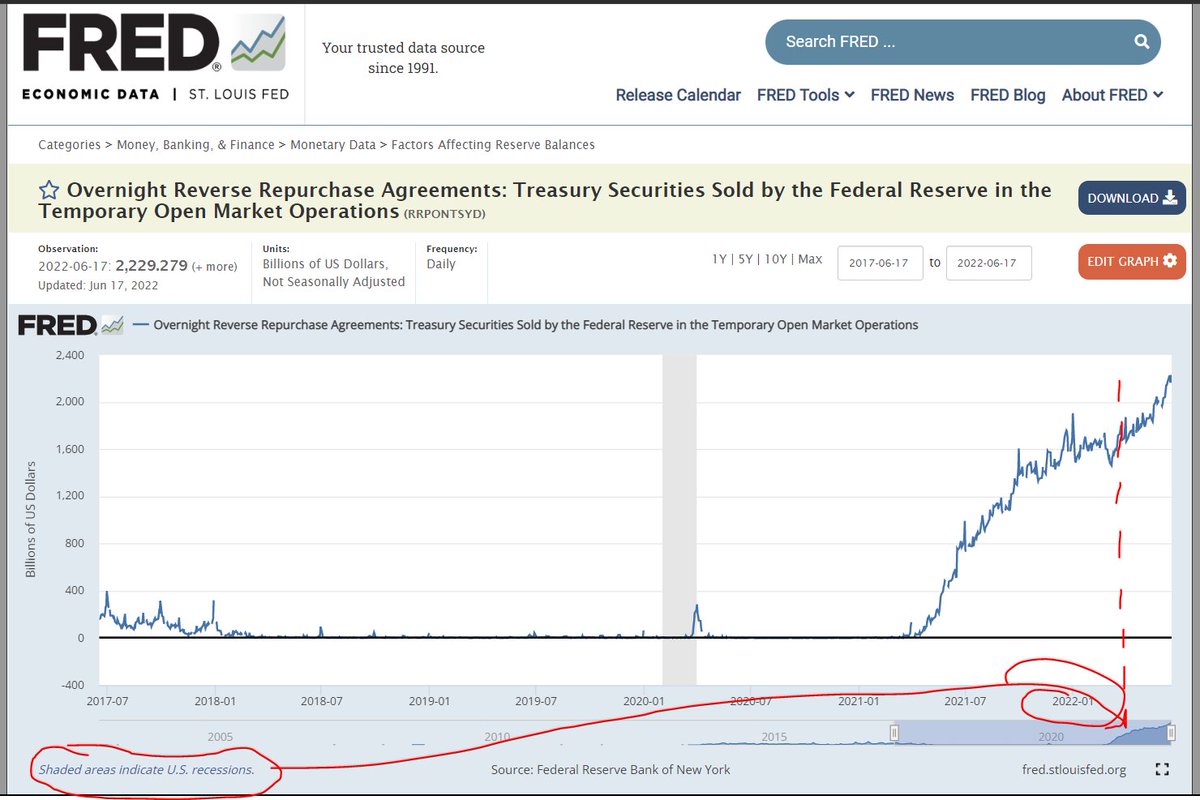 This means Central Banks are going to sell their equities and park cash at fed along with everybody else.