Mathematician. Antifascist. Used twitter mainly to write about India's covid19 epidemic. Words in The Wire, Scroll, The Hindu, The Quint, Caravan. He/him.
 In its strident rebuttal of the WHO estimates, the government claimed that 99.9% of deaths were registered in India in 2020. There are made-up statistics which are plausible, and others which are laughable. This one is laughable. Let's see an example of how absurd it is...

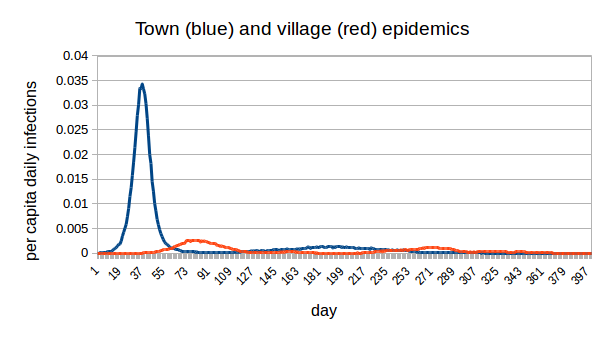
 Are the cases from the slums? Wardwise data suggests most are from non-slum areas. My estimate from the data: 15-20% of cases were from the slums in the last week. This in no way implies lower infection rates in the slums - we know detection in the slums is *much* weaker. (2/5)


 The great majority of people in the city have been either vaccinated or infected or both. There's a high level of population immunity in the city. More than 85% of both slum and nonslum-dwellers have COVID-19 antibodies. (80% of unvaccinated people.)
  The estimates, extrapolated from data from 12 states, put India's pandemic mortality at between 7 and 13 times the official death toll. They align broadly with estimates from several other groups, e.g.:
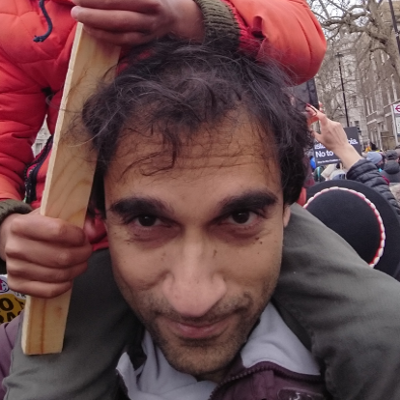
 By contrast, this picture shows that excess deaths do *not* align well with cases in Mumbai as a whole. But remember: cases in Mumbai are heavily biased towards nonslum areas, where detection of infections was about 8-9 times better. (2/n)
 Estimates are extrapolated using data from AP, Bihar, HP, Haryana, Karnataka, Kerala, MP, Maharashtra, Punjab, Rajasthan, Tamil Nadu & West Bengal. These cover around 60% of the country's population. National estimates will change - most likely increase - as more data comes in.


 In the city of about 13M people, there have been:
 Here are excess (registered) deaths calculated by four different methods. There were major surges in deaths in June-Aug 2020, and again in April-May 2021 (when the data ends). Different methods give excess mortality during the pandemic so far of ~2 per 1000 to ~3 per 1000. (2/7)
 First: during 2020, overall recorded C19 mortality was ~50% of excess mortality. Assuming no major drop in death registration, Mumbai was recording C19 deaths *much better* than most parts of the country. But things did not start that way.
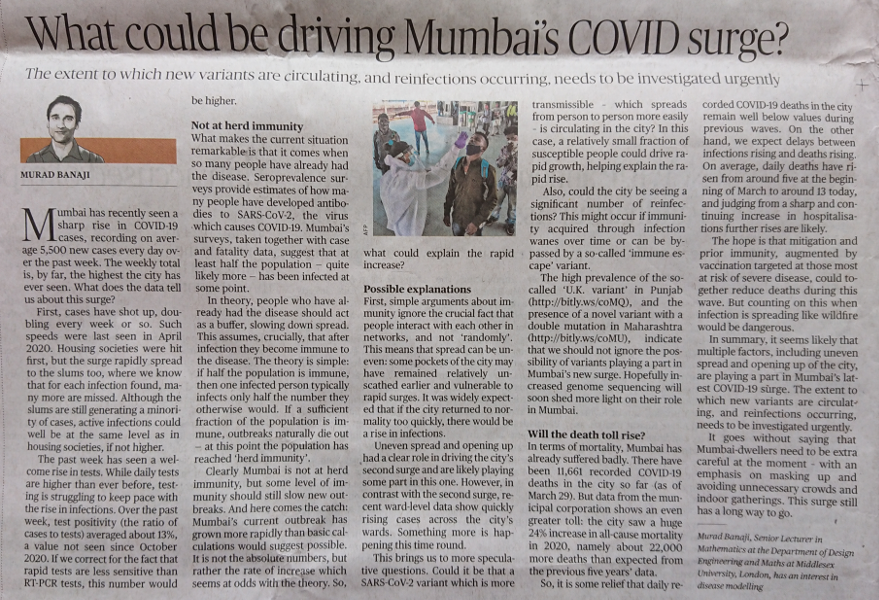

 We see an increase in case fatality rate at different delays. This comes after falls in April at most delays (a likely vaccination effect). As a wave subsides, test positivity falls and detection improves, we expect CFR to fall. The current pattern is very different.