Based at the Carolina Population Center at UNC-Chapel Hill, we help people understand and anticipate the impacts of population change.
Aug 13, 2021 • 4 tweets • 2 min read
🚨 #ncpol Reminder: the #2020Census release has legislative boundaries that do NOT align with NC's current districts. We used crosswalks from @nhgis to make files for:
- NC congressional districts
- NC House
- NC Senate
Largest population losses in NC counties:
Robeson: -17,638
Duplin: -9,790
Edgecombe: -7,652
Columbus: -7,475
Halifax: -6,069
Because of changes to #2020Census questionnaire, may see some declines in population identifying as a single racial group ("alone"), but see growth in groups "in combination" (more multiracial identification)
Aug 12, 2021 • 24 tweets • 8 min read
Follow THIS thread for our live tweets of the Census 2020 data release (starting in 3, 2, 1...)
Aug 12, 2021 • 6 tweets • 3 min read
Hello new followers! We're a group of demographers at UNC-Chapel Hill and we're here to help you navigate the new redistricting numbers that will be released at 1pm today by the @uscensusbureau@uscensusbureau Here's everything you need to know today:
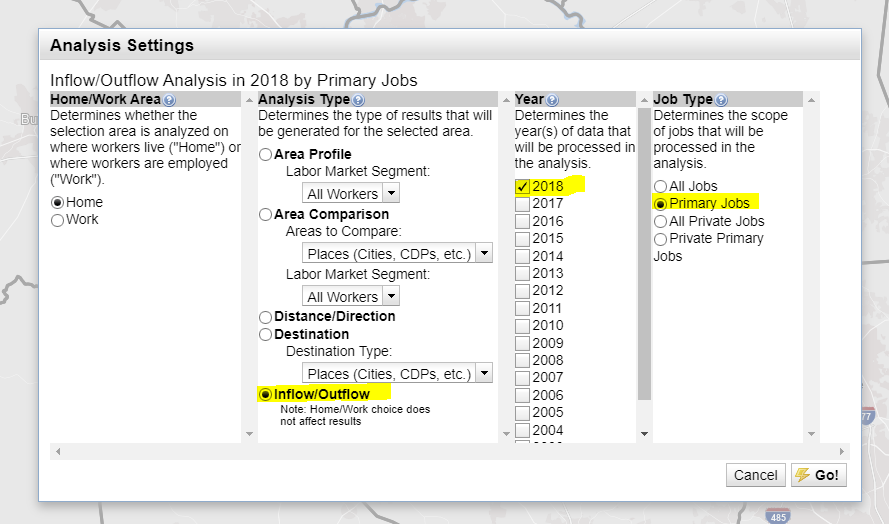
Hello! This is a thread 🧵 on how to determine how many people live in one county but work in a different county. (For example, if people live in Durham County but work in Wake County...)
The best tool to answer this is the OnTheMap application by the @uscensusbureau
This uses data from the LEHD Origin-Destination Employment Statistics and is current through 2018.
Jul 11, 2019 • 8 tweets • 4 min read
A number of groups have made maps showing hard-to-count communities for the upcoming #2020Census. We know a lot of people are at @ShorensteinCtr learning about Census coverage this week and thought we would share a list of these state-level maps.
1. Here's the one we developed with @NCCounts. It shows all of the communities across NC that will likely be hard to count in the upcoming Census. You can zoom in by county, and see demographic information related to census tracts: