
 2/7
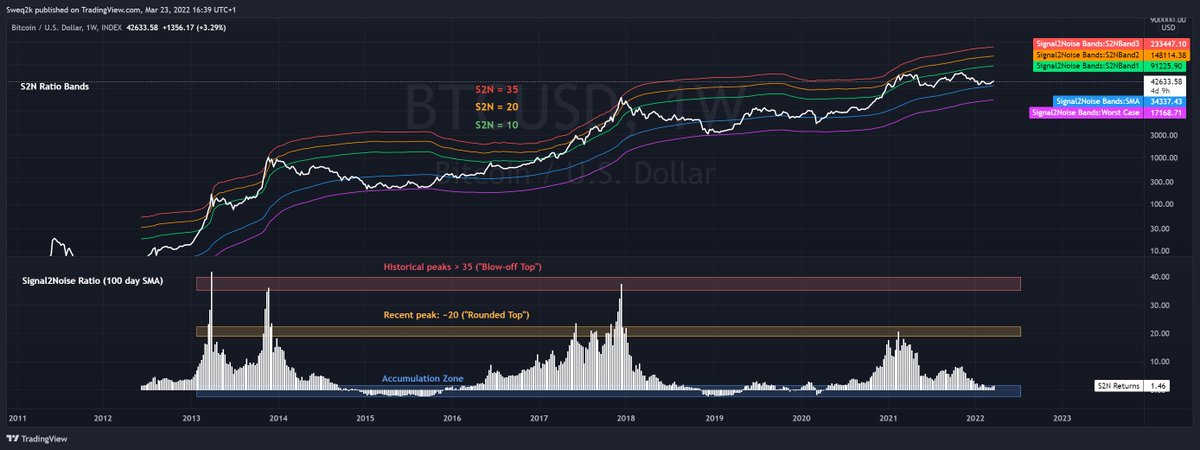
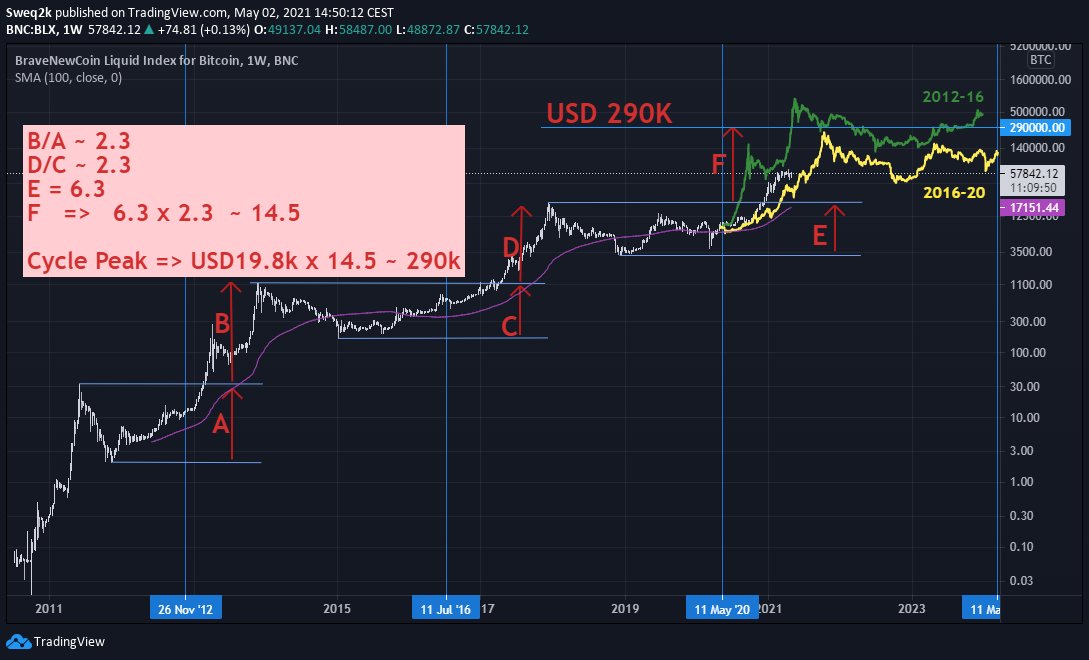
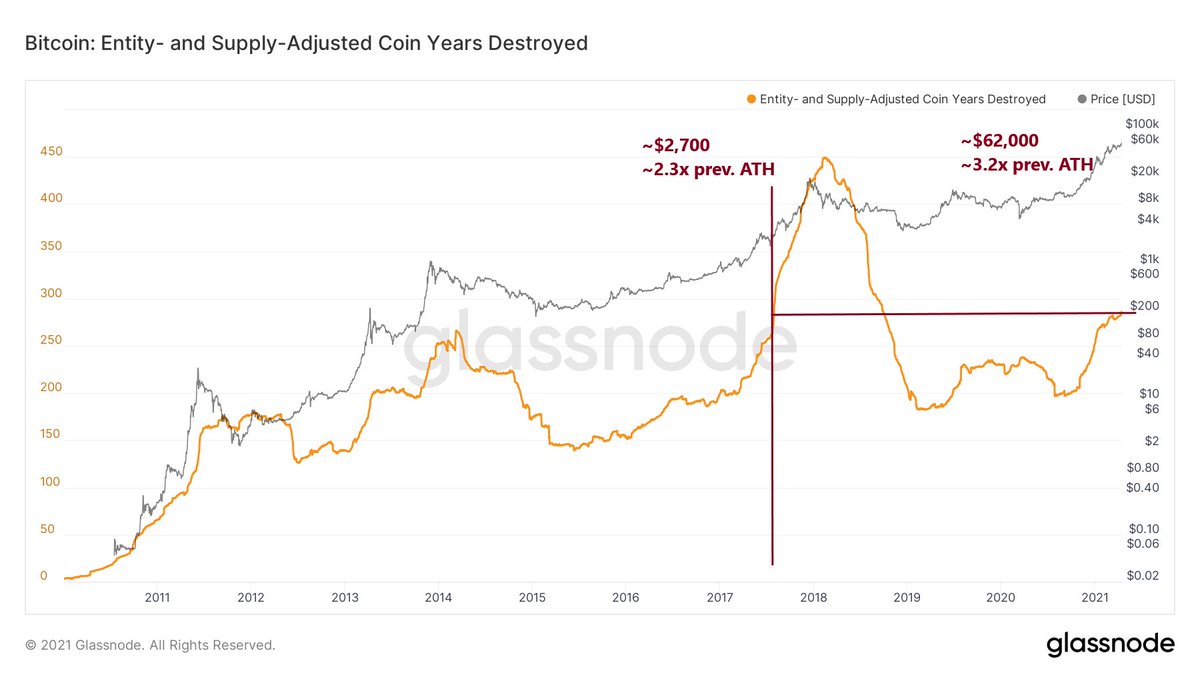
2/7 The study of BTCs price history teaches us the 4 year boom and bust cycle. However, one needs to ask the question, whether this pattern will continue or whether it was maybe driven by very specific factors and whether these factors might change.
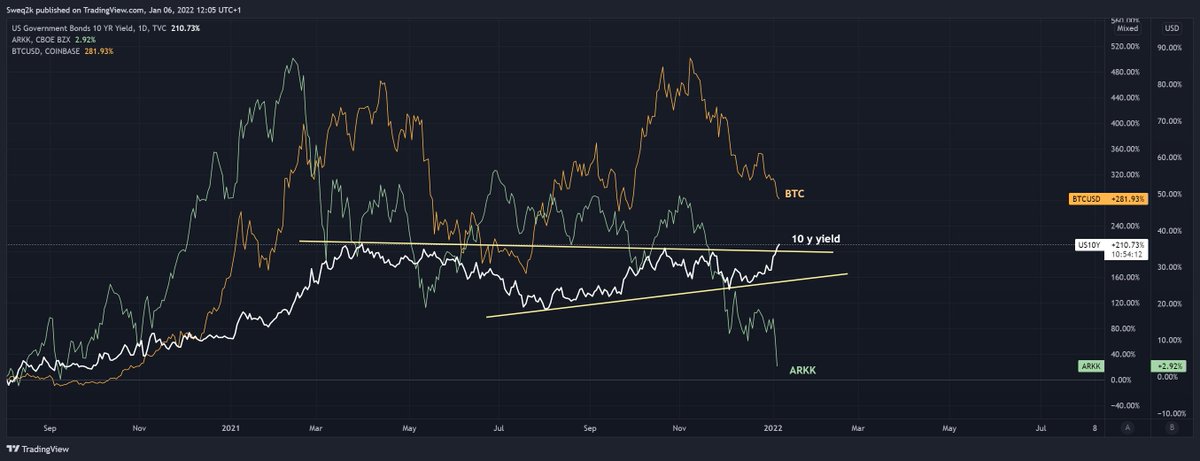 First, technically speaking, as shown in the previous tweet, correlations change over time and are not consistent. Just because some guys hold two chart patterns next to each other has nothing to do with long-term correlations. Correlations can change rapidly.
 2/8
2/8
 2/4
2/4
 2/25
2/25 2/12
2/12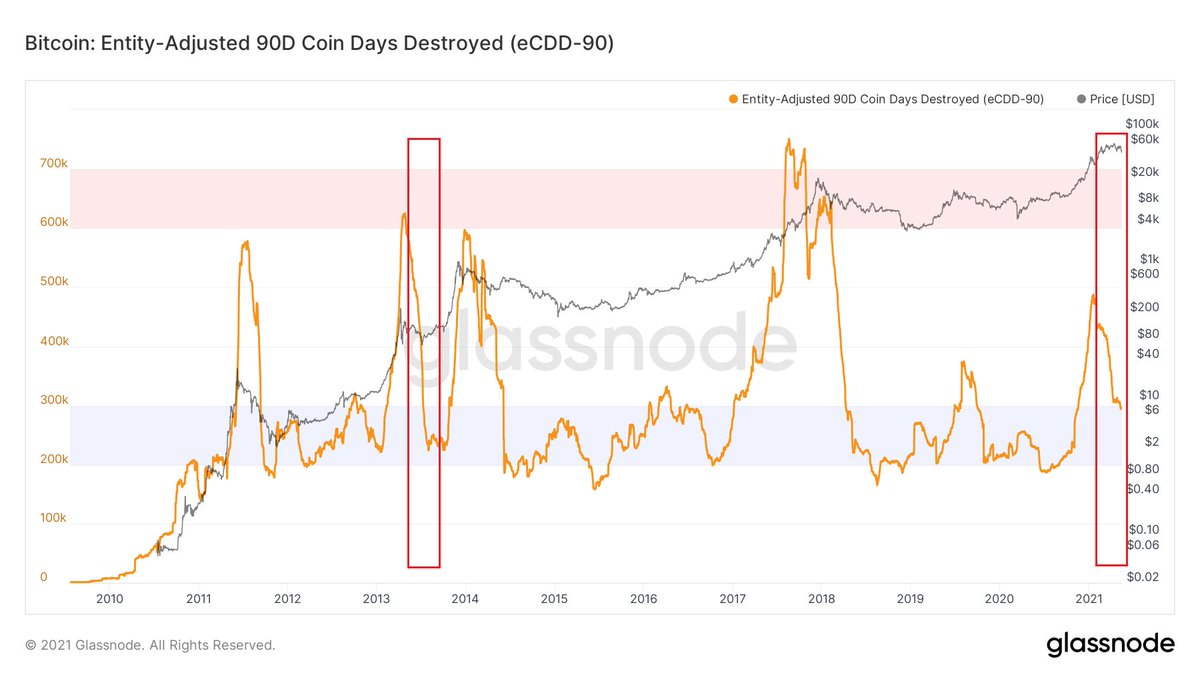 2/6
2/6 2/5
2/5 2/8
2/8
 2/21
2/21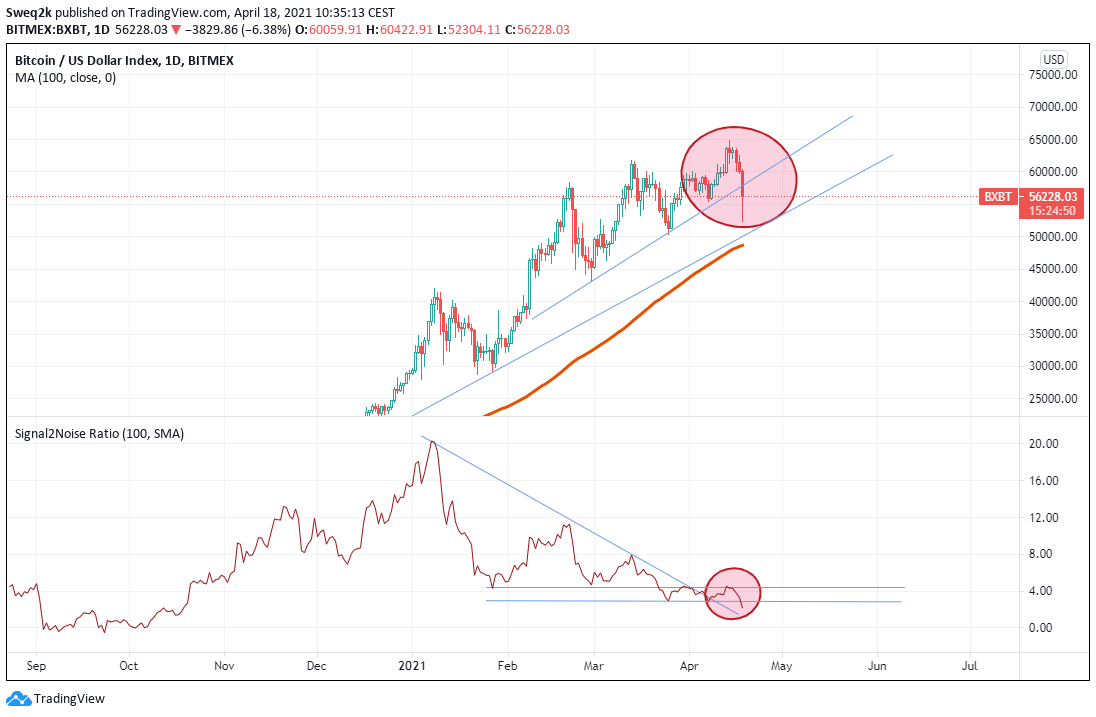
 2/n
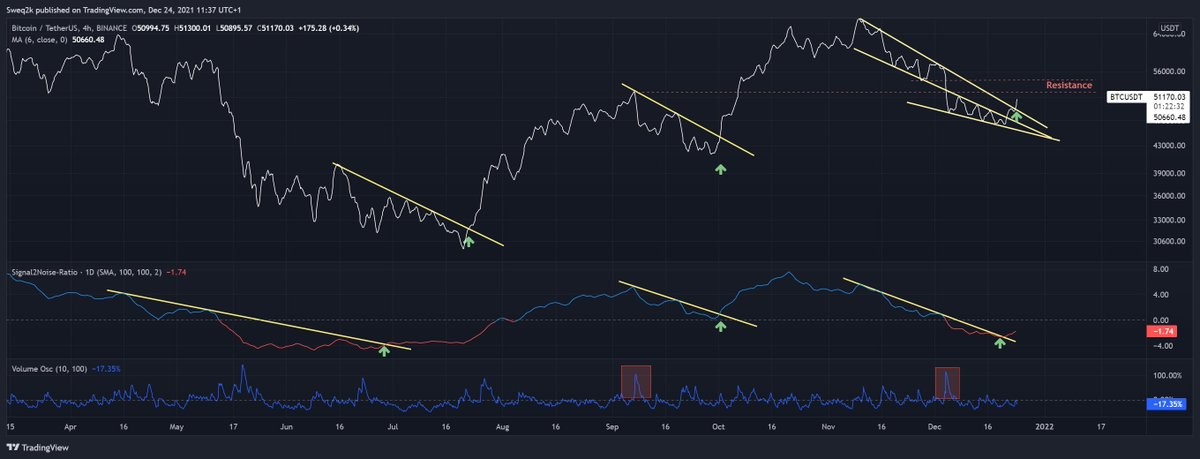
2/n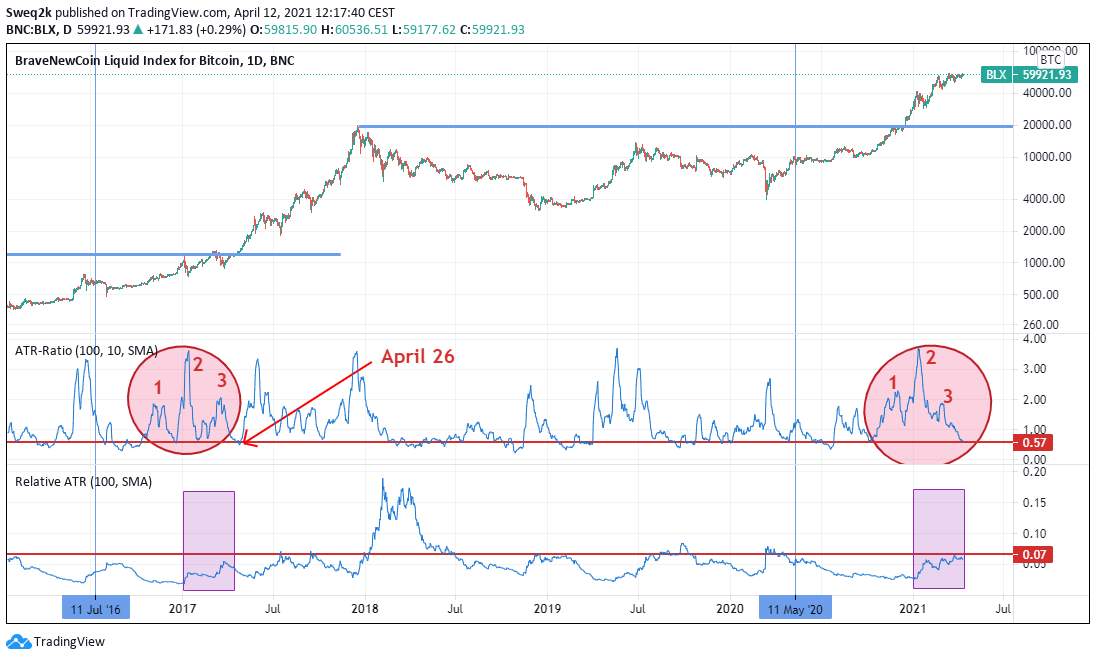 2/n The first indicator "ATR-Ratio" shows the ratio of short term (10 days) to medium term volatility (100 days). Higher values indicate higher volatility then trend and vice versa.
 2/
2/ 2/n
2/n