
Teacher | BSc(Hons) Applied Maths | Lover of all things stats | Cricket fan | I once solved a rubiks cube |
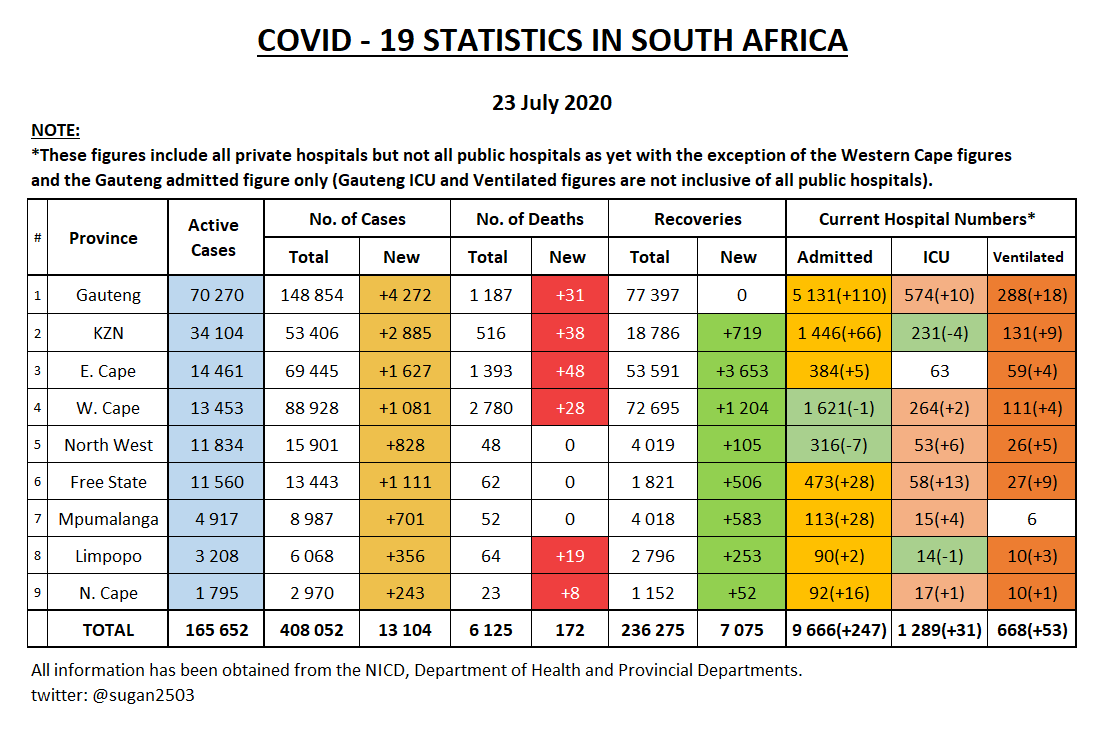
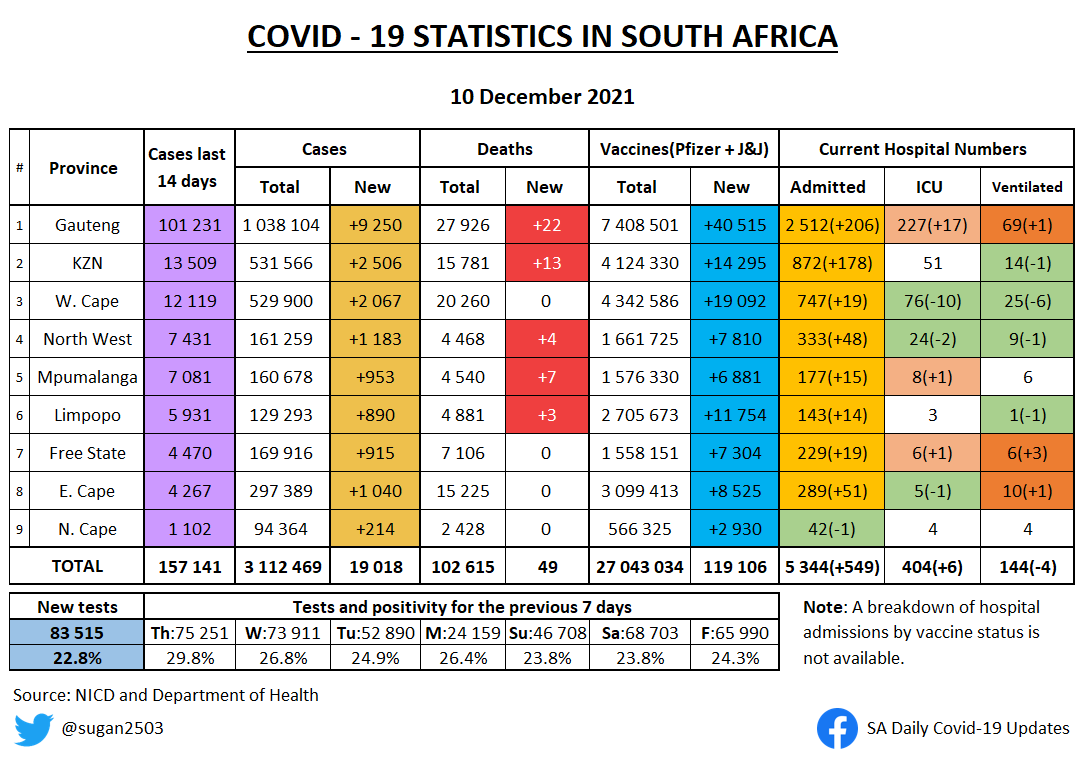 Weekly positivity rates
 Current admissions
 Weekly positivity rates
 7 day average of new deaths
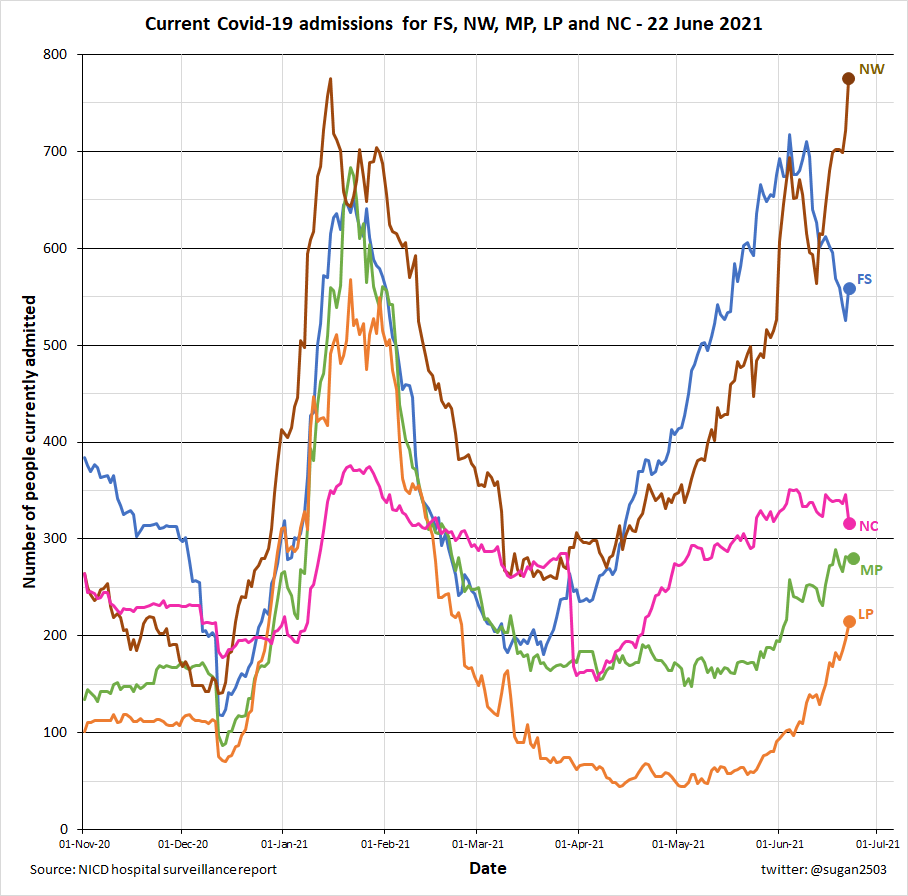
 Hospital numbers graph
 7 day average of new cases
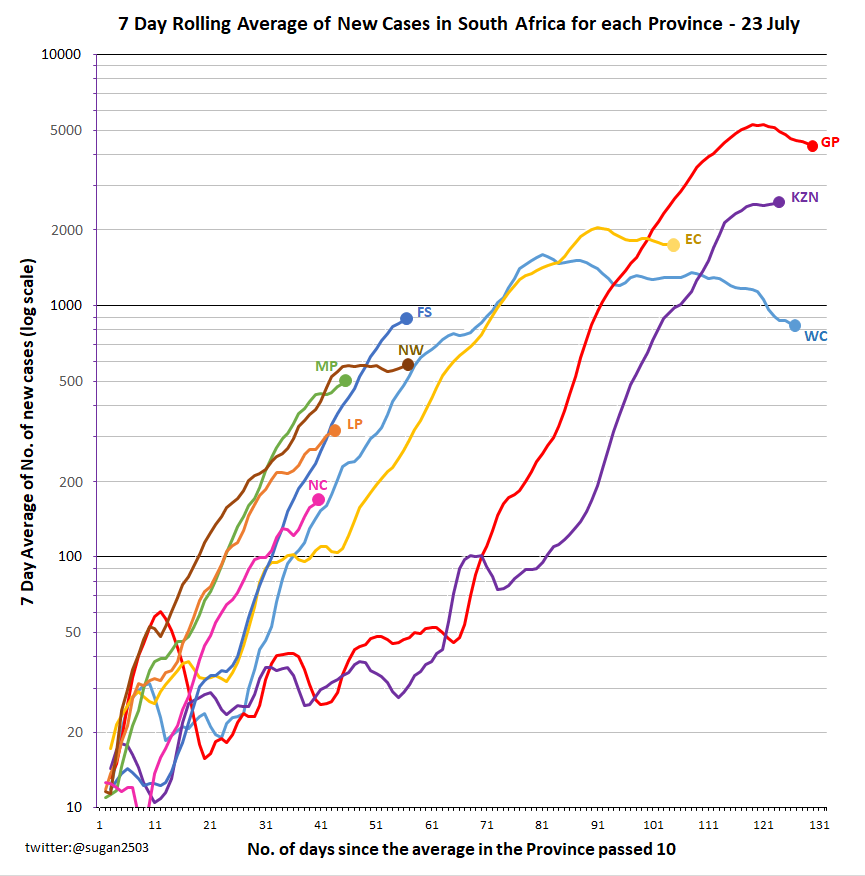
 Cumulatve cases graph
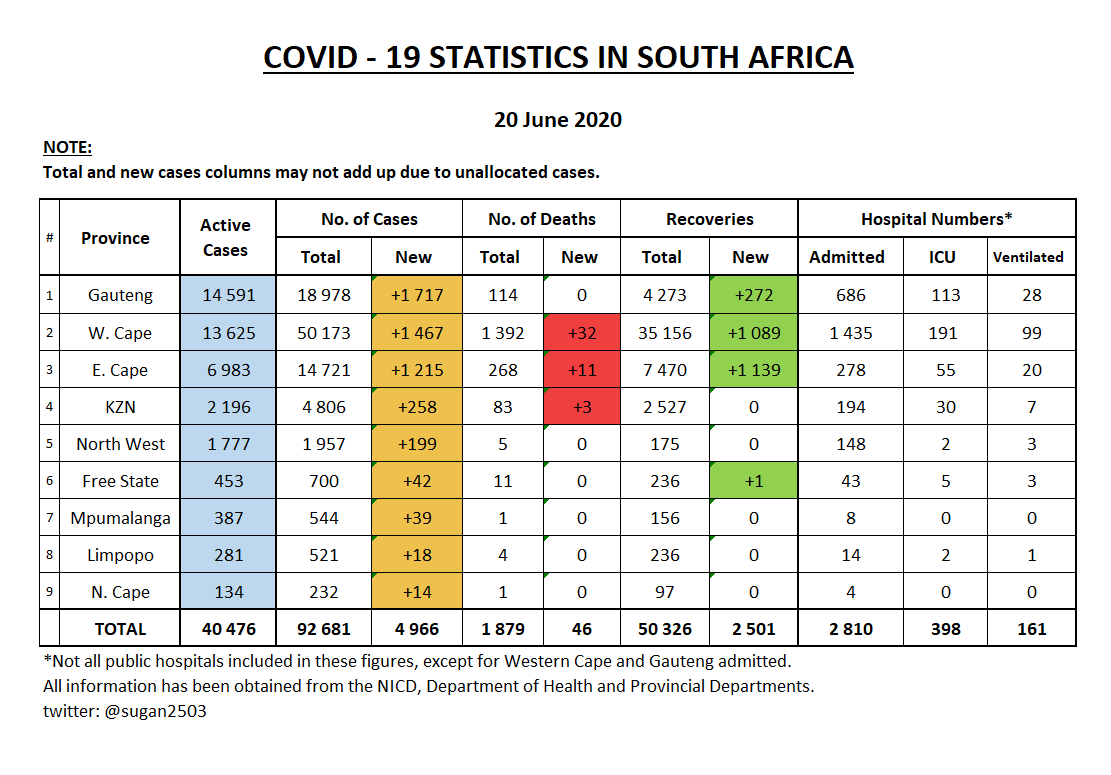 I know there's going to be a lot of talk about GP now having more active cases than WC, but in theory, I don't feel it's true.
 [1/3] Weekly deaths in SA from Natural causes:
 [1/2] Table on % of deaths per age category:
 Cumulative deaths per Province (As of 22 May)
 7 Day rolling Ave graph (As of 20 May):