In the drafting stages last summer of the #LowerHealthCareCosts Act, @MelindaBBuntin discussed three areas that drive these costs where policymakers could focus. What are those three areas?
1. Seek innovative ways to make sure that drugs are affordable and appropriately utilized.
2. Continue vigilance on payment rates.
3. Continue to advance value-based payment methods including episodes/bundles and more comprehensive risk-bearing models.
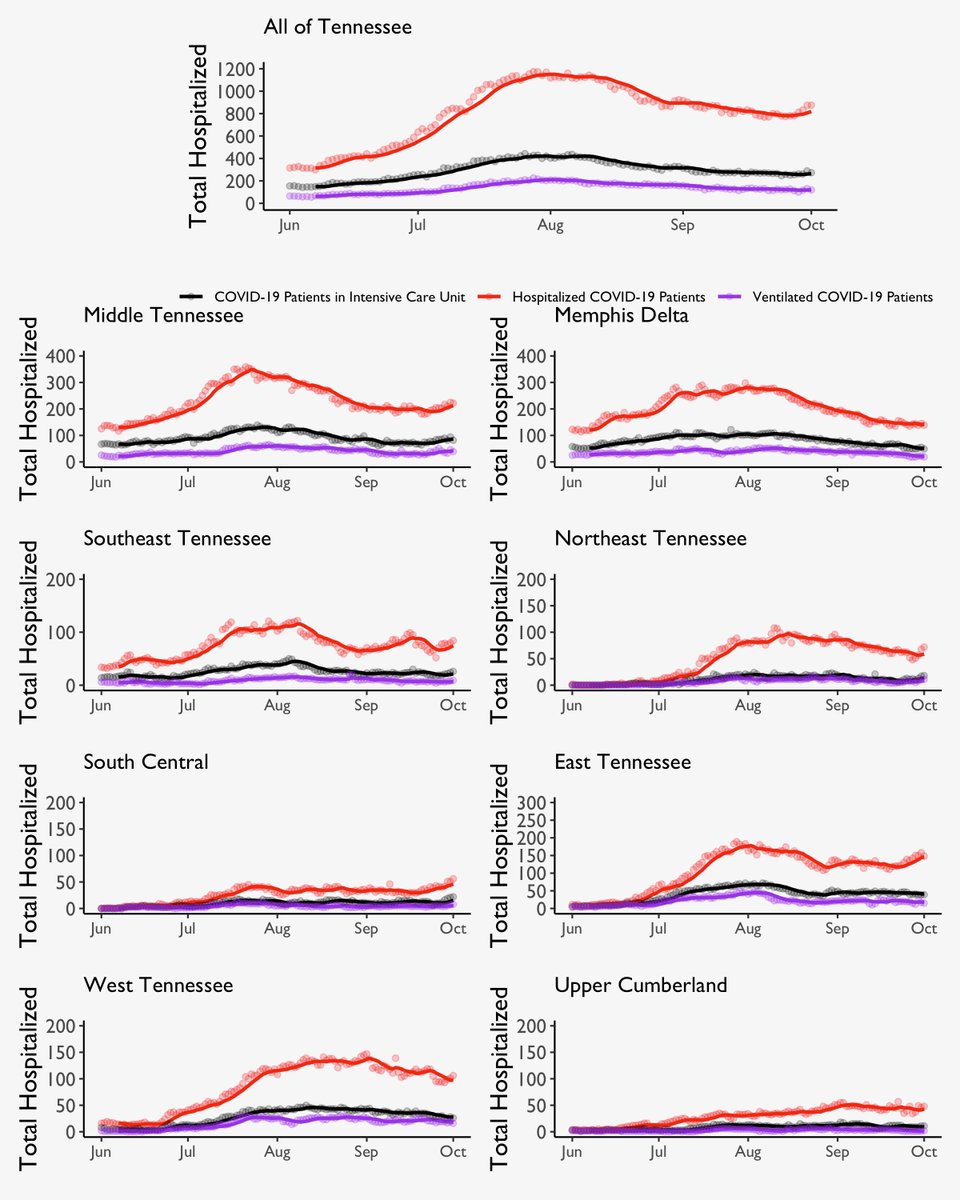
NEW: Today, #Tennessee hit an unfortunate milestone in the pandemic, reaching the highest level of hospitalizations (~3,500) from the virus yet. Several other regions are above the highest points from the winter as well. Many regions are still increasing very rapidly. 1/
Additionally, the use of ICU beds and ventilators are also well above their previous peak, which can impact access to vitally important care for anyone, not just COVID patients.
ICU use is 20% above previous peak. (⚫️ line)
Ventilator use is 40% above previous peak. (🟣 line) 2/
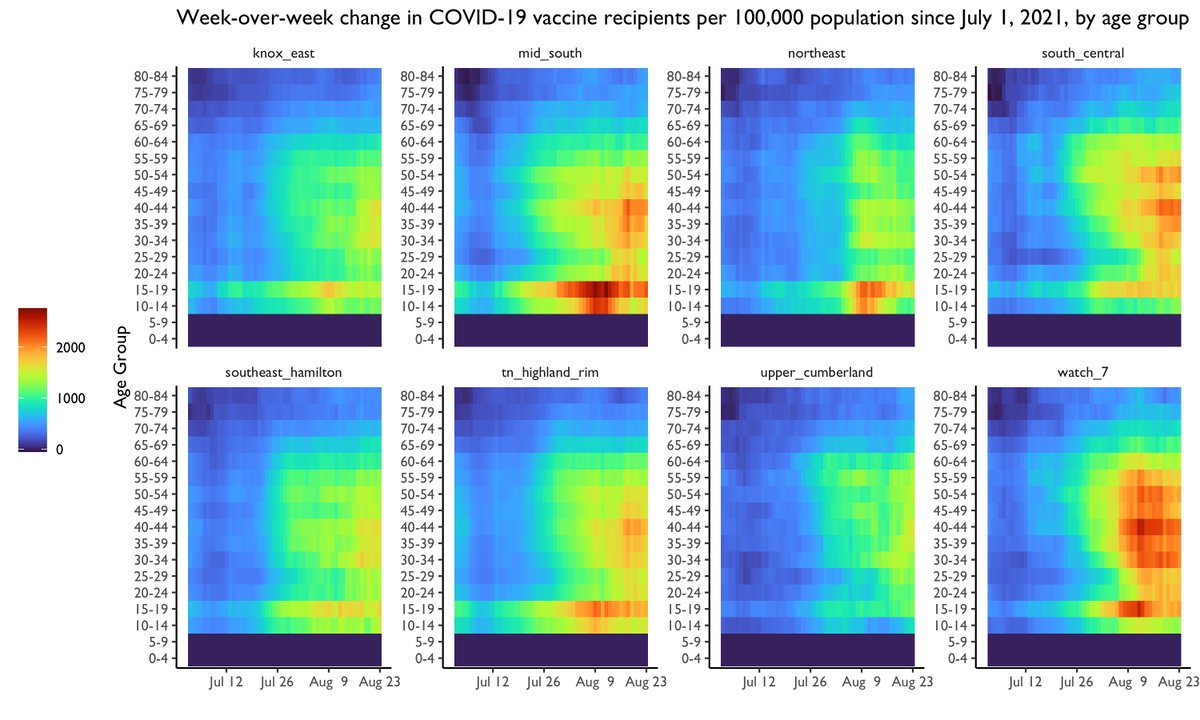
But the good news! In W. Tennessee and Memphis, the hospitalizations relative to Aug. 25 are down 10% and 4%, respectively. These are areas where we've seen high increases week-over-week in vaccinations, though it's not 100% certain the 2 are related. (Here thru 8/23) 3/
#COVID-19 in #Tennessee: TN leads the U.S. in cases reported per population this week. This is very serious but raises an important question: How should we interpret the latest numbers? A thread … 1/ nytimes.com/live/2020/12/2…
Let’s be clear on 1 thing: @TNDeptofHealth is correct that hospitals are beyond their “bend” point and quickly heading to their breaking point. We’re at 2,900 hospitalized and rising. A continued surge following the holidays will create a truly dire situation. 2/
But what about those case numbers? We’ve had several days of 11k+ reported in a single day…
Q: Are we really seeing daily case numbers that high?
NEW: Nashville news media have seen and reported rising #coronavirus hospitalizations in the past week, a trend we have also observed... 1/
However, what we have also seen is a shift in the age distribution of new #COVID19 cases in #Tennessee regions recently into older age groups, which we know to be at higher risk of poor outcomes, like hospitalization and death. 2/
So what does this mean? This is a trend to watch closely. New cases happen before hospitalizations, which could mean we might see increasing stress on the state’s health care system. 3/
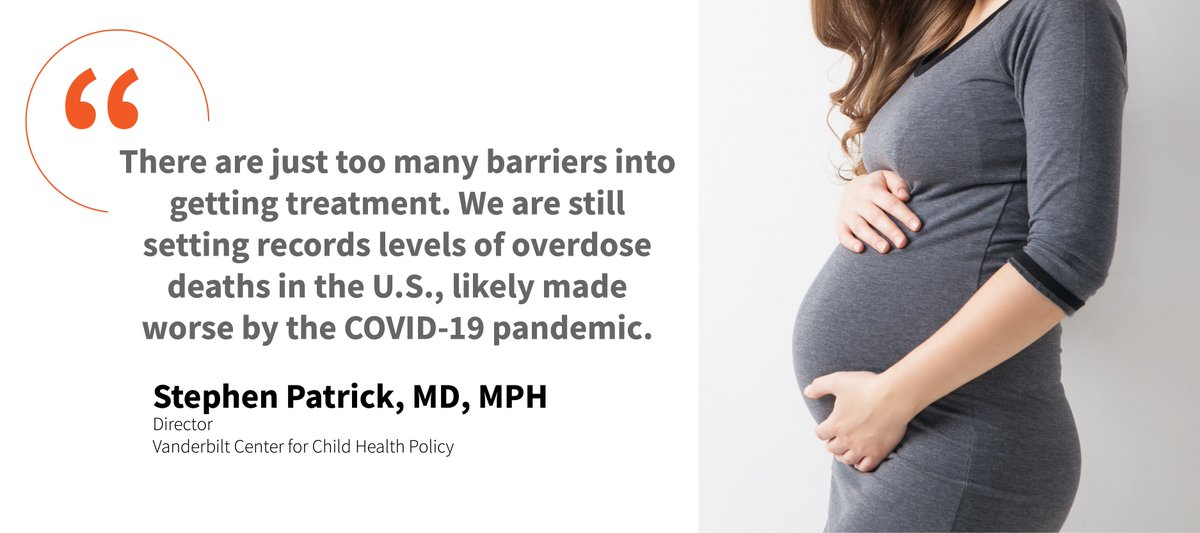
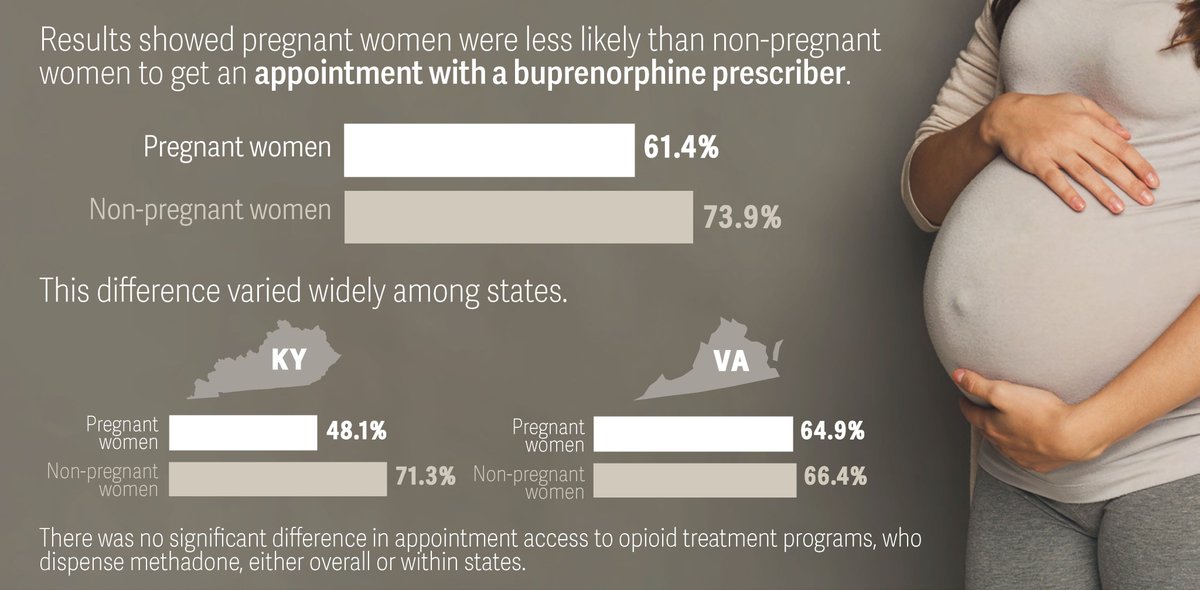
“Only about half of women were given an appointment for treatment with their insurance, the rest were either told no or had to pay cash. In some states, only about 1-in-5 women were given appointments with their insurance,” @stephenwpatrick said.
NEW: Hospitalizations for #COVID__19 continue to rise across #Tennessee, and age demographics for those patients is changing. Learn more in our newest report on the epidemic in Tennessee. ➡️ vumc.org/health-policy/…
Here is a "heat map" of median age by region over time. It's a very different situation depending where you are in Tennessee. Age is a leading risk factor, per the @CDCgov
Overall, #Covid hospitalizations are on a steep incline in different parts of the state as well. Read the full report here ➡️vumc.org/health-policy/…
NEW: Here's an updated look at Tennessee's #COVID19 transmission number (R0), and where the most cases are over the last 10 days. (Data current as of July 6.)
Find this and more resources on the public health response to the pandemic here ➡️ vumc.org/health-policy/…
As a reminder, an R0 above 1.0 means the virus is spreading and gaining momentum, and people who are infected are infecting more than 1 other person on average.
Here's a closer look at the area around #Memphis. (Note: Gray boundaries are counties, shaded areas are ZIP codes)