In preparation for the upcoming IPCC oceans report, we put together detailed look at past and future sea level rise (SLR) over at @CarbonBrief. A quick thread to examine the details: carbonbrief.org/explainer-how-… 1/11
We looked at five observational estimates of SLR; three featured in the 2013 IPCC report and two newer ones. The attached graph shows both the total sea level rise (top), which was between 0.18 and 0.2m (180 to 200mm) since 1900, and the rate of SLR (bottom)
Theres been debate around whether current rates of SLR exceeds those in the 1940s. Three of the five datasets (Dangendorf, Hay, and Church and White) suggest that the current rate of sea level rise – via satellite altimeters – is around 50% faster than in the 1940s. 3/11
The Ray and Douglas dataset suggests that current rates of SLR measured by satellite altimeters are modestly above the 1940s peak, while one of the five – Jevrejeva – suggests that the current rate of SLR is below that of the 1940s. 4/11
However, even the authors of the Jevrejeva dataset suggest in their accompanying paper that a longer view of sea level – from 1800 to present – still suggests that “the rate of sea level rise is increasing with time”. 5/11
One of the major drivers of the SLR the world has experienced is the thermal expansion of water. As the ocean warms, seawater becomes less dense and expands, raising sea levels. Glaciers, ice sheets, and changes in land water storage also contribute to SLR. 6/11
While glacier melt and thermal expansion were responsible for the majority of historical SLR, this has been changing in recent years. There are now larger contributions to SLR coming from ice sheet melt and changes in land water storage – driven in part by groundwater depletion.
According to the 2018 BAMS State of the Climate report, melting glaciers and ice sheets contributed two thirds of the total SLR between 2005 and 2016, considerably more than in the 1993-2010 period, suggesting a growing role of ice sheet melt. 8/11
Since AR5 in 2013, a number of new studies have been published, many of which have substantially higher worst-case SLR estimates by 2100 than those published in the IPCC AR5 – largely due to a reassessment of the potential losses from Antarctic and Greenland ice sheets. 9/11
As @AndraJReed et al suggest, "the IPCC reports have tended to err on the side of providing intentionally cautious and conservative estimates of SLR, rather than focusing on less likely, extreme possibilities that would be of high consequence, should they occur". 10/11
Given the body of literature suggesting that the high-end IPCC estimates may be overly conservative, it would not be surprising if the upcoming IPCC Special Report due out on Wednesday considered potential 21st century SLR estimates higher than those in the IPCC AR5. 11/11
• • •
Missing some Tweet in this thread? You can try to
force a refresh
Looks like @_david_ho_ and I confused a lot of folks around carbon cycle responses to CO2 removal, so a slightly longer thread would be useful to explain the nuance here.
TLDR: CDR still negates an equal amount of positive emissions as long as it stays out of the atmosphere. 1/
When we add a ton of CO2 to the atmosphere, only about half of it stays there over a longer (century-scale) timeframe, with the other half absorbed by ocean and biosphere carbon sinks. This is a good thing; it means atmospheric CO2 is only half as high as would otherwise be! 2/
Specifically, when we add a ton of CO2 to the atmosphere, 20% of that ton is absorbed by sinks quite quickly (~5 years), 40% is absorbed in the first 20 years, and 60% is absorbed over the first 100 years. However, about 20% will still be in the atmosphere in 500k years! 3/
I've long argued against being overly deterministic about climate outcomes based on emissions scenarios, and this article is case-in-point. A 4C warming by 2100 outcome by 2100 is unlikely, but unfortunately we cannot fully rule it out today. reason.com/2022/02/09/wor…
Specifically, current policy outcomes result in ~2.7C warming, while worlds where we meet our Paris commitments result in ~2.4C. The new paper covered in this article implicitly models a world of strengthening policy where we end up around 2.2C.
But all these numbers come with large uncertainties; even if we know future emissions for certain, the amount of warming we end up with also depends on climate sensitivity and carbon cycle feedback uncertainties.
Climate change is a huge challenge that is impacting us today, and gets worse every year our emissions remain above zero.
But way we talk about climate impacts can at times counterproductive and disempowering. Climate is, ultimately, more of a matter of degrees than thresholds.
The world has warmed by 1.2C since the late 1800s, and will very likely pass 1.5C in the 2030s. A 1.5C world is one of notably worse impacts on human and natural systems than today.
But its not a "tipping point" that necessarily results in significant additional warming.
Earth systems that we consider potential tipping elements - ice sheets, permafrost, coral reefs, AMOC, amazon rainforest, among others – respond to changing temperatures spatially and temporally heterogeneously.
Zero emissions will ultimately require replacing fossil fuels with zero-carbon alternatives. We have mature(ish) tech to get a long way there – perhaps half or two thirds. But we need to prepare for hard-to-decarbonize parts even while we more rapidly deploy what we have today.
Behavior matters too, but its hard to disentangle behavior from technology. For example, having compelling plant alternatives helps people stop eating beef. Better public transport makes it easier to reduce car/flight use, etc. iea.org/articles/do-we…
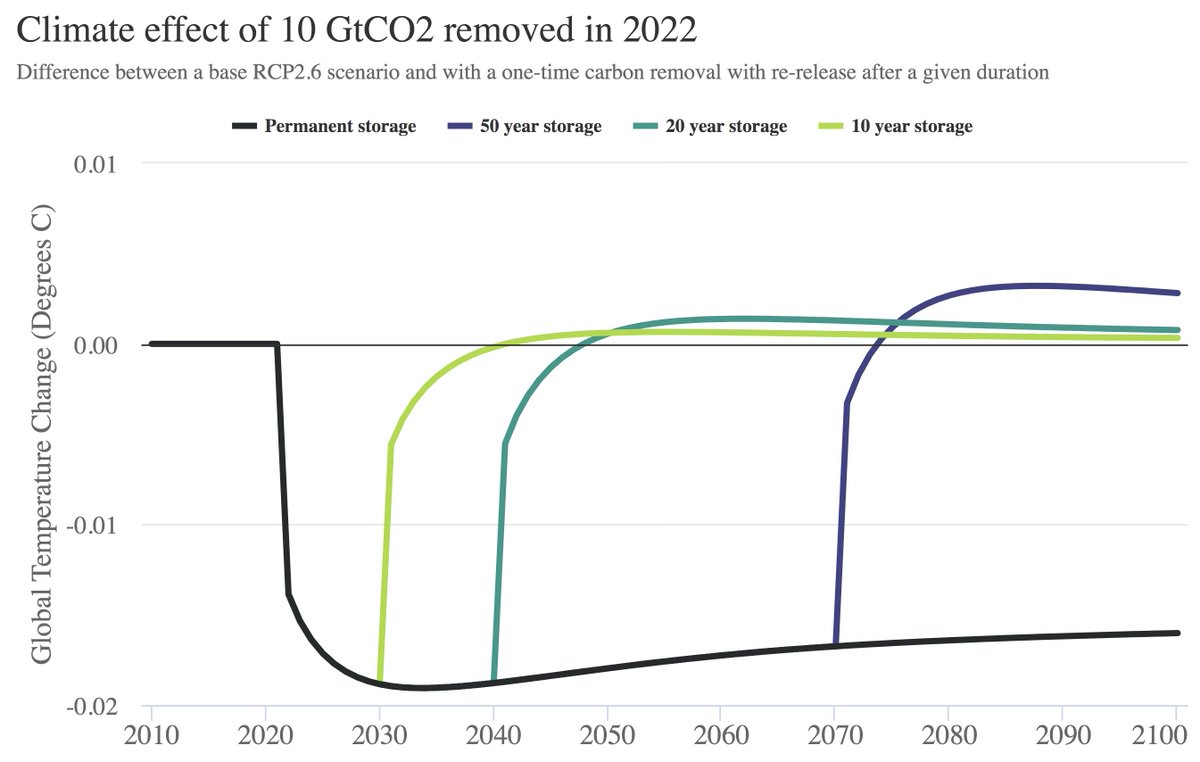
Carbon removal is important, but how long it stays out of the atmosphere makes a big difference on resulting climate impacts. Here are the results of a simple climate model simulating a one-time removal of 10 GtCO2 in 2022, which is stored for 10, 20, 50, or 100+ years:
The figure shows the difference between a deep mitigation scenario (RCP2.6) with and without 10 GtCO2 removed in 2022, which is then re-released after a given period. There are a few interesting dynamics at work here.
Once the CO2 is re-released the climate quickly warms in response, though its buffered a bit by ocean heat uptake times. Somewhat counterintuitively, after re-release we actually end up with more more long term warming than if the CO2 had never been captured in the first place.
Many countries have adopted net-zero commitments later this century. In most cases these apply to all GHGs, not just CO2, and are structured using 100-year global warming potentials (GWP-100).
It turns out this choice effectively commits countries to a lot of carbon removal. 1/
If you add together different GHGs using GWP-100 it does a pretty poor job of simulating actual warming. It conflates flow pollutants (like CH4) with stock pollutants (like CO2) in ways that are unhelpful, as I discussed last year in this thread:
While we can get close to zero CO2 emissions (at least in theory), it will be much harder to remove all the CH4 and N2O emissions from agriculture. This means that a zero-GHG target is actually a negative-CO2 target, where CO2 removal is balancing out remaining CH4 and N2O.