1/ Systematic Trading (Robert Carver)
Thread
"Systematic investing is more profitable and requires less time and effort [than discretionary trading]. A system removes emotion and makes it easier to commit to a consistent strategy." (p. vii)
amazon.com/Systematic-Tra…
Thread
"Systematic investing is more profitable and requires less time and effort [than discretionary trading]. A system removes emotion and makes it easier to commit to a consistent strategy." (p. vii)
amazon.com/Systematic-Tra…
2/ "The distinction between financial gambling, trading, and investing is meaningless: all involve taking risk on uncertain outcomes.
"Indeed, professional gamblers usually have a better understanding of risk management than many people work in the investment industry." (p. ix)
"Indeed, professional gamblers usually have a better understanding of risk management than many people work in the investment industry." (p. ix)
3/ September 2008: "Our computer system had stuck to its pre-programmed set of trading rules and mechanically exploited the market moves almost to perfection, whilst terrified humans had discussed closing it down.
4/ "Humans are better than computers at complex intellectual tasks, but our emotions prevent us from fully utilizing this intelligence. The solution is to use systems.
"People have been using systems to trade for decades, but they are still in a small minority." (p. 3)
"People have been using systems to trade for decades, but they are still in a small minority." (p. 3)
5/ "The illusion of control (which encourages the perception of skill) is present with all forms of active investing. Ironically, the feeling of control is almost absent when investing systematically, which is one reason many people find it difficult to trade this way." (p. 16)
6/ "Creating a purely objective system is a powerful commitment mechanism. If your instinct goes against a *subjective* system, you'll soon be bending the rules.
"But if everything is clearly defined, it creates a line in the sand beyond which any deviation is obvious." (p. 18)
"But if everything is clearly defined, it creates a line in the sand beyond which any deviation is obvious." (p. 18)
7/ "The best trading setup consists of a computer, a man, and a dog. The computer runs a fully automated strategy, the man feeds the dog, and the dog bits the man if he touches the computer.
"A system which is fully automated but not completely trusted is potentially lethal.
"A system which is fully automated but not completely trusted is potentially lethal.
8/ "Any sane person would be tempted to shut it down at the first sign of trouble. Automation aids commitment, but only with a well-designed system in which you have confidence.
"I prefer systems that are objective, simple, transparent, & based on underlying hypotheses." (p. 19)
"I prefer systems that are objective, simple, transparent, & based on underlying hypotheses." (p. 19)
9/ "The most serious bias of all is overconfidence, which manifests itself in a lack of diversification. Most individual investors own relatively few securities with a bias toward their home country as well as a lack of diversification across asset classes.
10/ "You might think that experts, with access to sophisticated quantitative tools, wouldn't make those mistakes. Unfortunately, they often do: they don't consider the considerable uncertainty in expected asset returns.
11/ "The most commonly used optimizations assume precise knowledge of future returns. The resulting extreme portfolios can be worse than those of individual investors.
"In practice, experts fiddle with optimizations until the results reflect their own expectations." (p. 20)
"In practice, experts fiddle with optimizations until the results reflect their own expectations." (p. 20)
12/ "According to the normal distribution, we should get daily falls of more than 4σ about once a century. But from 1914 to 2014, the U.S. Dow Jones index full by more than 4σ around 30 times.
"The size of your positions must reflect the amount of risk you can handle." (p. 23)
"The size of your positions must reflect the amount of risk you can handle." (p. 23)
13/ "A strategy that is intuitive is much easier to trust. If a stock's price rises, a trend-following system ought to be buying. If the strategy sold instead, that might be a cause for concern, and you would check for bad data or software bugs." (p. 28)
14/ "Many years of data are necessary to properly test a strategy. Some hedge funds have recently used Google search popularity and Twitter trending to forecast markets. These make good press releases, but there won't be enough data to properly evaluate them for many years.
15/ "You might also struggle to compare data between instruments. For example, accounting measures aren't consistent across countries because of differing rules and standards. This means that inter-country equity value strategies are difficult to implement." (p. 29)
16/ "Classical finance theory assumes people will borrow freely, but many investors cannot or will not do so.
"Although the availability of derivatives has increased substantially, they are still a tool for the brave minority. Many institutional funds do not borrow either...
"Although the availability of derivatives has increased substantially, they are still a tool for the brave minority. Many institutional funds do not borrow either...
17/ "High Sharpe ratio assets with low returns but even lower volatility will remain unloved by those who require high returns and can't borrow.
"As a result, undiversified portfolios are common, with equities contributing nearly all the volatility." (p. 35)
"As a result, undiversified portfolios are common, with equities contributing nearly all the volatility." (p. 35)
18/ "Trading to minimize taxes or to 'window dress' creates seasonal effects. Insurance companies buy rare long-maturity bonds to hedge liabilities.
"As long as the position size of those forced to trade is greater than those who exploit them, opportunities will persist." (p.36)
"As long as the position size of those forced to trade is greater than those who exploit them, opportunities will persist." (p.36)
19/ "The law of active management states that the Sharpe ratio [or information ratio if a benchmark is used] of a trading strategy will be proportional to the square root of the number of independent bets made per year.
20/ "Trading a group of half a dozen asset classes, the returns of which will be relatively uncorrelated, can have [risk-adjusted] returns that are two to three times those for a single asset." (p. 42)
21/ "Relative value strategies that need high leverage are particularly vulnerable to crowds. After a stable period of rising markets, these trades get swamped by people seeking extra returns.
22/ "Available profits are reduced, apparent risk falls, and required leverage increases further. Then the music stops, and the negative skew becomes horribly apparent.
"Two classic examples are the meltdown of LTCM in 1998 and the Quant Quake in 2007." (p. 45)
"Two classic examples are the meltdown of LTCM in 1998 and the Quant Quake in 2007." (p. 45)
23/ "Only a minority of traders are profitable. Most likely to be losers are day traders and those in relatively expensive markets such as retail FX spread betting.
"There are two apparently easy ways to increase Sharpe ratios, both of which are incredibly dangerous.
"There are two apparently easy ways to increase Sharpe ratios, both of which are incredibly dangerous.
24/ "You could trade negative skew strategies. A very high Sharpe ratio is often a result of hidden negative skew. The SR can still be excellent even after a blow-up.
"For example, the SR of Long-Term Capital Management, the fund which blew up in 1998, was around 4.6." (p. 47)
"For example, the SR of Long-Term Capital Management, the fund which blew up in 1998, was around 4.6." (p. 47)
25/ "The second path to the mirage of higher Sharpe is to trade more quickly.
"However, this assumes that opportunities can be found at shorter time scales and ignores trading costs.
"It's impossible, even in theory, to trade expensive instruments quickly & profitably." (p. 47)
"However, this assumes that opportunities can be found at shorter time scales and ignores trading costs.
"It's impossible, even in theory, to trade expensive instruments quickly & profitably." (p. 47)
26/ "A balanced combination of trading rules with different styles that work in different environments is better than any single alternative. It's important to understand and be able to cope with the risks and behavior of the trading system." (p. 48)
27/ "In practice, there isn't usually a statistical difference between the performances of different instruments, particularly if they are closely related, such as a group of equity index futures.
"Pooling your data is an excellent way of getting more data history...
"Pooling your data is an excellent way of getting more data history...
28/ "which gives you a better shot at being able to distinguish profitable from loss-making trading rules.
"I have two rules which, for a single instrument, have Sharpe ratios averaging 0.05 and 0.30. Despite being perfectly uncorrelated, I'd need 45 years to distinguish them.
"I have two rules which, for a single instrument, have Sharpe ratios averaging 0.05 and 0.30. Despite being perfectly uncorrelated, I'd need 45 years to distinguish them.
29/ "The same rules run on a portfolio of instruments have Sharpe ratios of 0.13 and 1.13. I'd need just 11 years of data to distinguish these two Sharpe ratios from each other." (p. 65)
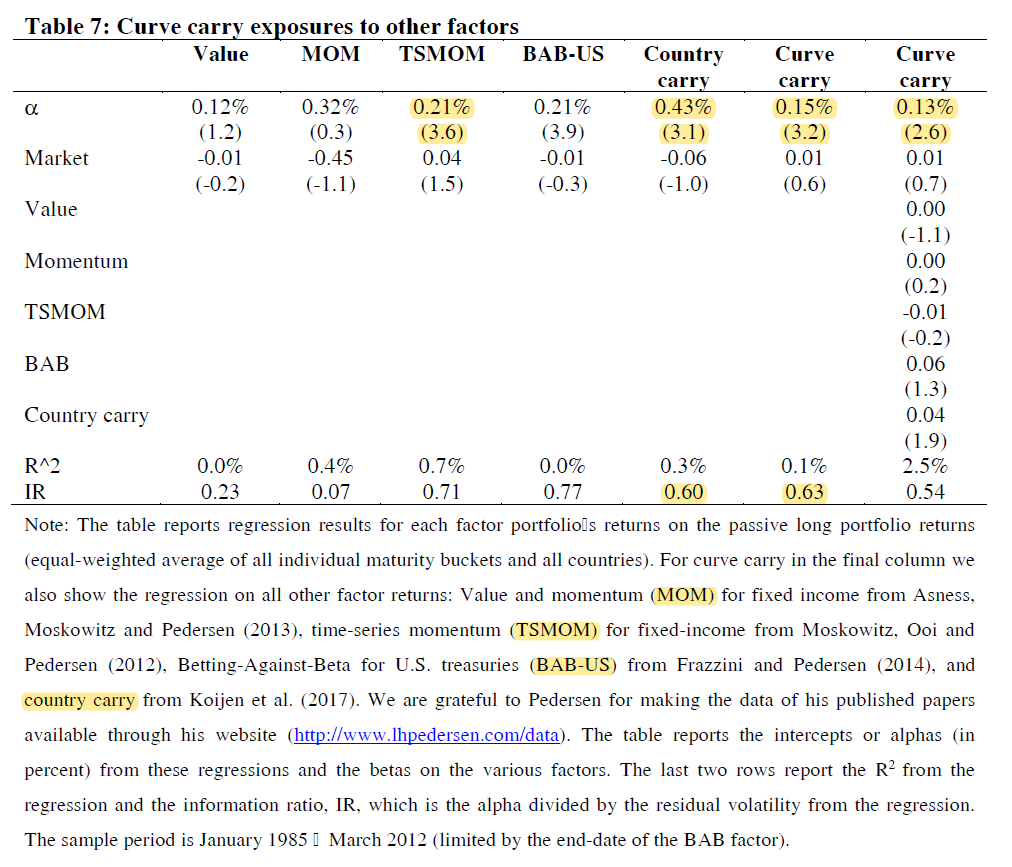
This is a theme AQR examines in detail for value and momentum:
This is a theme AQR examines in detail for value and momentum:
30/ "Look carefully before picking one rule and discarding others based on past performance. It's unusual in reality to find highly correlated rules with radically different performance.
31/ "More likely, you get rules with a Sharpe ratio difference of ≈0.5 but no correlation, or highly correlated variants with similar performance. In both cases, you need 30 years of data to differentiate them. It's difficult to justify picking one on performance alone." (p. 66)
32/ So what do you do with hundreds of rule variants and no compelling reason to choose one over the others?
A reasonable answer is to use them all:
The extra diversification can lead to lower risk and more reliable performance:
A reasonable answer is to use them all:
The extra diversification can lead to lower risk and more reliable performance:
33/ "Be careful about focusing on outright performance rather than returns relative to benchmarks. This is very dangerous because equities and bonds have done extraordinarily well over the last 40 years.
34/ "The easiest way to get extra back-tested profits is to use trading rules which are more highly correlated with the underlying asset classes. This is unlikely to work in the future, as the main cause of these high returns was significant falls in inflation." (p. 67)
35/ Goyal & Jegadeesh examine this in detail by comparing cross-sectional and time-series momentum.
They find that market timing benefit is greater for shorter lookback windows, while longer windows get their performance from passive asset class exposure.
They find that market timing benefit is greater for shorter lookback windows, while longer windows get their performance from passive asset class exposure.
36/ "This doesn't mean I don't use performance to fit trading rules and variations. Instead, returns data is reserved for finding forecast weights. These weights determine in what proportion each variation is used to predict each instrument's returns." (p. 67)
37/ "The marginal value of adding additional trading rules is low, especially if they are of the same trading style. The average correlation between different rules trading a particular instrument is higher than between instruments trading the same rule.
38/ "Diversification amongst instruments is preferable to rule diversfication.
"Adding new instruments is a tiresome task of uploading and checking data, which is less fun than coming up with more trading rules, but it is of far greater benefit." (p. 68)
"Adding new instruments is a tiresome task of uploading and checking data, which is less fun than coming up with more trading rules, but it is of far greater benefit." (p. 68)
39/ "Blind use of optimization results in ugly portfolios with extreme weights. Just because an equation is wonderful to behold doesn't mean you should slavishly use its results without regard of consequences.
"The unspoken assumption is that the equation MUST be right." (p. 70)
"The unspoken assumption is that the equation MUST be right." (p. 70)
40/ "We should be able to do better than equal weights, as there is data about correlations. A good portfolio would have more diversifying bonds than equities but wouldn't take much account of the insignificantly different Sharpe ratios.
41/ "However, the classic optimizer doesn't work like this. It uses only the average Sharpe ratio and correlation, not knowing or caring how much uncertainty there is in each estimate." (p. 74)
42/ "Using in-sample handcrafting rather than rolling out-of-sample bootstrapping gave an insignificant advantage (Sharpe ratio of 0.54 rather than 0.52). In comparison, in-sample single-period optimization produced an unrealistically high Sharpe ratio of 0.84...
43/ "although when I used the single-period optimization to perform a rolling out-of-sample fit, it did much worse than the other two methods, with a Sharpe ratio of 0.3." (p. 85)
44/ "Expected Sharpe ratios make good return forecasts and makes creating trading rules very intuitive: any rule can be used without modification on all instruments and can be fitted using pooled data from multiple instruments." (p. 112)
45/ "Normally, markets trend with falls followed by further falls, but after very sharp drops, subsequent one-day rises are more likely (the so-called 'dead cat bounce'). Similarly, high-yielding stocks do well, but those with dividend yields above 50% are probably going bankrupt
46/ "or, at the very least, about to cut their dividends.
"These effects are often not strong or common enough to exploit directly, but they should give you concern about betting too much when you have very strong forecasts." (p. 114)
"These effects are often not strong or common enough to exploit directly, but they should give you concern about betting too much when you have very strong forecasts." (p. 114)
47/ "A high forecast could mean that you expect large returns but equally might be due to very low standard deviation of returns. Unfortunately, periods of subdued volatility are usually followed by jumps to much higher levels, often combined with reversals in price." (p. 114)
48/ "I don't recommend using backtested profitability to select trading rules or variations. Instead, focus on behavior (correlations, trading speed), ignoring Sharpe ratios and other performance metrics.
"For many instruments, fast rules will be expensive to trade." (p. 122)
"For many instruments, fast rules will be expensive to trade." (p. 122)
49/ "Your individual forecasts should have the same [risk-adjusted] expected variability, but unless your trading rules are perfectly correlated, the combined forecast will end up with less.
"The magnitude of the fall in σ depends on the degree of diversification." (p. 128)
"The magnitude of the fall in σ depends on the degree of diversification." (p. 128)
50/ "Diversification multiplier: A correlation of 0.5 implies a multiplier equal to the target volatility of 10% divided by the natural portfolio volatility of 8.66%. This will be 10/8.66 = 1.15.
"If the two assets are completely uncorrelated, the multiplier is 1.44.
"If the two assets are completely uncorrelated, the multiplier is 1.44.
51/ "You will get even higher values with negative correlations. However, this results in dangerously large multipliers, so I recommend flooring estimated correlations at zero.
"Correlations can be estimated with data from backtests or by using rule-of-thumb values." (p. 129)
"Correlations can be estimated with data from backtests or by using rule-of-thumb values." (p. 129)
52/ "Financial advisor: How much risk do you want to take?
Me: What do you mean by risk?
Advisor: Er... how would you define your tolerance for losing money?
Me: It could be how much I'm prepared to lose next year. Or tomorrow. Or next week. Are you talking about the absolute...
Me: What do you mean by risk?
Advisor: Er... how would you define your tolerance for losing money?
Me: It could be how much I'm prepared to lose next year. Or tomorrow. Or next week. Are you talking about the absolute...
53/ "minimum loss I can cope with, or the average, or the worst loss I'd expect 95 days out of 100? Which question would you like me to answer?
Advisor: Hold on. I need to speak to my supervisor..."
Carver: "I use an expected standard deviation as a volatility target." (p. 137)
Advisor: Hold on. I need to speak to my supervisor..."
Carver: "I use an expected standard deviation as a volatility target." (p. 137)
54/ "A volatility target is the long-term average of expected, predictable risk.
"You'll also face unpredictable risks if your forecast of volatility or correlations is wrong.
"The volatility target isn't the maximum or even the average you might expect to lose in a year.
"You'll also face unpredictable risks if your forecast of volatility or correlations is wrong.
"The volatility target isn't the maximum or even the average you might expect to lose in a year.
55/ "1. If your Sharpe ratio is greater than zero, your expected annual loss will be smaller than 1σ.
"2. In the event of losses, you'd probably reduce your positions if you're using trend following rules.
"3. You should reduce your positions when price volatility rises.
"2. In the event of losses, you'd probably reduce your positions if you're using trend following rules.
"3. You should reduce your positions when price volatility rises.
56/ "If consecutive returns aren't independent and instead have time-series autocorrelation [trends], then multiplying daily volatility by 16 is a poor approximation of annual volatility." (p. 137)
57/ "With negative skew, it's vital to have sufficient capital to cope with the very bad days, weeks, and months you will occasionally see. This is especially true with high leverage and the risk your broker will make a margin call at the worst possible time.
58/ "With positive skew, the difficult is psychological: committing to a system when you spend most of your time suffering cumulative losses." (p. 140)
59/ "Even if you are able to leverage up to hit a particular volatility target, it would be very unwise if excessive gearing is needed. This is particularly problematic for negative skew instruments and trading strategies, which tend to have low natural risk - until they blow up.
60/ "With a 200% volatility target and a Sharpe ratio of 0.50, the chances of losing half your capital over ten years are 90% with a positive skew of 1.0 and 97% with a negative skew of -2.0.
61/ "With a given vol target, ensure that no individual position will wipe you out after the largest conceivable move. Diversifying amongst many different instruments will also help.
"Very low volatility instruments requiring insanely high leverage should be excluded." (p. 143)
"Very low volatility instruments requiring insanely high leverage should be excluded." (p. 143)
62/ "It's very difficult to know exactly what your true Sharpe ratio really would have been in the past, with back-tests giving you only a roughly upwardly estimate, and it's utterly impossible to know what Sharpe ratio to expect in the future.
63/ "Even if you had a crystal ball and knew your expected Sharpe precisely, you could be unlucky and have a decade or more of sub-par performance.
"If you get your estimate of Sharpe ratio wrong and bet more than optimal, you have a large chance of losing your shirt." (p. 145)
"If you get your estimate of Sharpe ratio wrong and bet more than optimal, you have a large chance of losing your shirt." (p. 145)
64/ "Even if you could avoid over-fitting, profits are unlikely to be as high as in the past: future [long] asset returns are likely to be lower than in the historical data set.
"The absolute max. Sharpe we should expect is 1.0, regardless of how good the backtest is." (p. 146)
"The absolute max. Sharpe we should expect is 1.0, regardless of how good the backtest is." (p. 146)
65/ "Using the full Kelly criterion is far too aggressive because of the risk of getting a poor run of luck and the resulting drawdown, even if Sharpe ratio expectations are correct.
"It's far better to use half-Kelly.
"It's far better to use half-Kelly.
66/ "My back-tested Sharpe ratio is 1.0, which gives me a realistic achievable SR of 0.75. That would be a 75% volatility target at full Kelly, which I then halved to get 37%.
"At the time of writing, I'm using a 25% target, reflecting my relatively low appetite for risk.
"At the time of writing, I'm using a 25% target, reflecting my relatively low appetite for risk.
67/ "This assumes your trading system, like mine, has zero or positive skew.
"Many negative skew strategies have fantastic back-tested Sharpe ratios, but I advise you to run them at half the risk you'd use for a more benign trading system." (p. 146)
"Many negative skew strategies have fantastic back-tested Sharpe ratios, but I advise you to run them at half the risk you'd use for a more benign trading system." (p. 146)
68/ "The returns of asset allocating investors are limited by the use of a static trading strategy. With a small, relatively un-diversified portfolio, you shouldn't expect high Sharpe ratios.
69/ "For a dozen equities in different industries but the same country, you will probably achieve a Sharpe ratio of around 0,20. Those with larger portfolios diversified across multiple asset classes could get a maximum realistic Sharpe ratio of 0.4." (p. 147)
70/ "A 50% annualized volatility target will mean substantial losses from time to time. Just because Kelly-based vol targets are optimal doesn't mean they suit you or that your broker will permit them. It just means you should *never* run a higher risk target than this." (p. 148)
71/ "One of the simplest ways to estimate future volatility is to use a measure of recent standard deviation. Volatility tends to persist: if the market has been crazy over the past few weeks, it will probably continue to be crazy for a few more weeks." (p. 155)
72/ "Shorter look-back windows mean your volatility estimate is noisy, which will mean higher trading costs but quick reactions to changes. Slower estimates are smoother but will take longer to adjust.
"Use longer look-backs for instruments that are expensive to trade." (p. 156)
"Use longer look-backs for instruments that are expensive to trade." (p. 156)
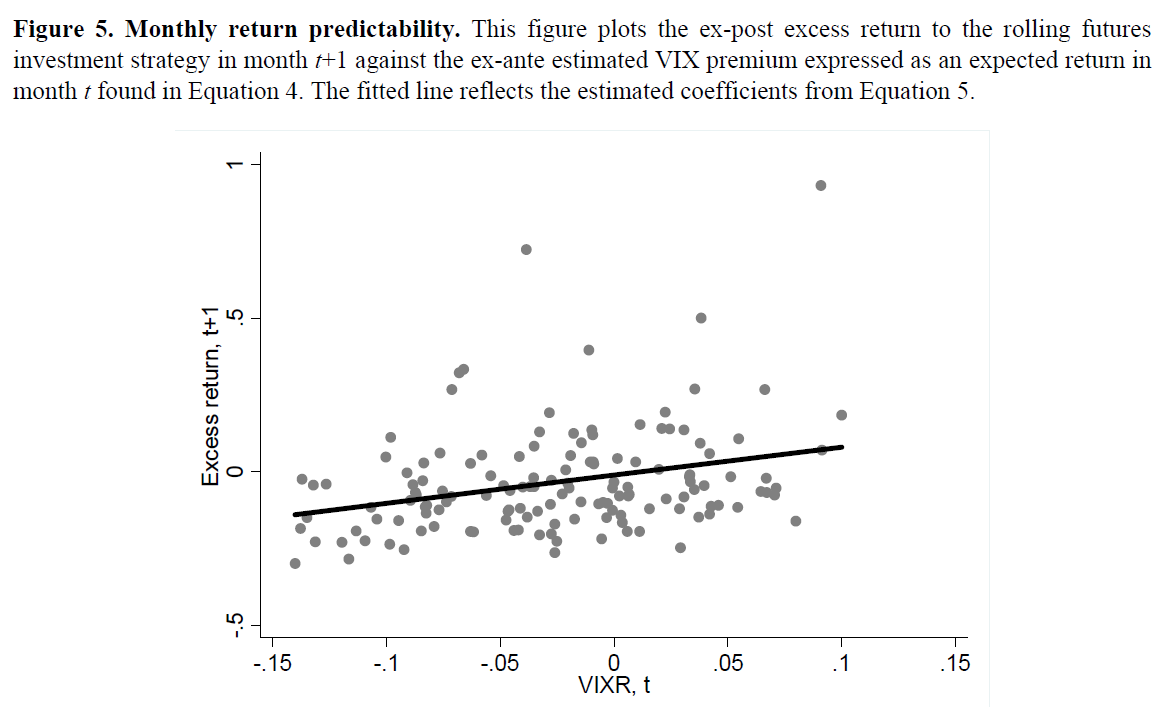
73/ There's information about volatility targeting in the thread below, including tests of different look-back windows and the use of volatility targeting for L/S factor portfolios:
The Impact of Volatility Targeting
The Impact of Volatility Targeting

74/ "An exponentially weighted moving average gives a smoother measure than a simple moving average but still reacts quickly to changes.
"Recent price volatility is generally a good way to get the right risk-adjusted position size....
"Recent price volatility is generally a good way to get the right risk-adjusted position size....
75/ "However, it would have been a disaster if you were using recent volatility to size credit default swaps in early 2007, the front of the Eurodollar futures curve at any time in the U.S. zero interest rate period, or the Swiss franc in early January 2015.
76/ "During all of those periods, there was very low price volatility. After periods of calm, markets have a nasty habit of becoming crazy overnight, leaving you with dangerously large positions. Holding very low volatility assets is generally a bad idea." (p. 156)
77/ "Diversification is the only free lunch in investing. Allocating across different asset classes can easily double your expected Sharpe ratio. It's best to run a portfolio of as many trading subsystems and instruments as possible." (p. 165)
78/ "A good approximation is that the correlation between dynamic trading subsystem returns will be 0.70 of the correlation of instrument returns. If two assets have a correlation of 0.5 (instrument returns), their trading subsystems will have a correlation of ≈0.35." (p. 168)
79/ "In a crisis like the 2008 crash, correlations tend to jump higher, resulting in serious losses. I strongly recommend limiting the value of the diversification multiplier to an absolute maximum of 2.5." (p. 170)
80/ "Avoid trading unless the target position is more than 10% from the current position. This significantly reduces trading costs.
"My research shows that this position inertia usually has a negligible effect on pre-cost performance, so there is no downside." (p. 174)
"My research shows that this position inertia usually has a negligible effect on pre-cost performance, so there is no downside." (p. 174)
81/ "The effective cost of trading is higher for instruments of lower price volatility [more contracts are needed to get the same volatility risk exposure]. This is another reason to exclude very low risk instruments from your portfolio." (p. 182)
82/ "The relative pre-cost Sharpe ratio you will achieve in practice is extremely uncertain, while expected costs can be predicted much more accurately. In addition, in many markets, trading costs were much higher in the distant past than they are now." (p. 187)
83/ "A fast trading rule might look great in a backtest, but if the instrument was very expensive to trade, nobody could have exploited it. With lower costs, the effect may vanish now.
"Set a speed limit: a maximum expected turnover you will allow your systems to have." (p. 187)
"Set a speed limit: a maximum expected turnover you will allow your systems to have." (p. 187)
84/ "It's foodhardy to pay more than a third of your expected Sharpe ratio in trading costs; I use that to set my own speed limits.
"If you're realistic, the Sharpe ratio for each instrument using its own trading subsystem is unlikely to be higher than 0.40 on average." (p. 187)
"If you're realistic, the Sharpe ratio for each instrument using its own trading subsystem is unlikely to be higher than 0.40 on average." (p. 187)
85/ "To day trade even the cheapest instruments, you will need to achieve very high pre-cost Sharpe ratios or have execution that consistently captures the bid-ask spread. Only those with a proven record of achieving these goals should contemplate trading this quickly." (p. 188)
86/ "If stops are set very tight, you'll have short holding periods and high turnover. You won't be able to trade more expensive instruments with tight stops after accounting for a speed limit on what you're willing to pay in Sharpe ratio costs." (p. 192)
87/ "I don't like to fit or calibrate trading rules using pre-cost performance. However, I positively encourage you to back-test and find the expected turnover of your trading rules and then reject variations that are too expensive." (p. 193)
88/ Using trading costs divided by volatility < 0.13 to set a speed limit, "you should reject trading rules with turnovers greater than 130 round trips/year for the very cheapest futures (cost 0.001 SR per unit of turnover) and 65 round trips for the Euro Stoxx future." (p. 193)
89/ "It is simplest to use the same trading rules and variations for all the instruments you trade. This means you will need to drop any rules which are too fast for the most expensive instrument you have; the remaining rules will automatically be fine for the cheaper ones.
90/ "However, if the set of instruments you have features trading costs that vary significantly, you might consider using faster variations only with the cheapest instruments and using a slower set for the expensive ones.... this is the approach I use." (p. 193)
91/ "Volatility targeting is an additional source of turnover. The costs you actually pay will be inflated by the forecast diversification multiplier. But for faster rules, those are more than compensated by position inertia: not trading position changes of less than 10%.
92/ "All this makes it very hard in practice to estimate the expected costs of trading a particular rule. Looking solely at the turnover of the [trading rule] forecast is the simplest approach and is usually conservative enough." (p. 193)
93/ "I haven't found consistent evidence that faster trading rules, whether in general or as variations of a single rule, have higher pre-cost Sharpe ratios.
"Assume the same pre-cost Sharpe but account for differing trading costs to adjust forecasted Sharpe ratios." (p. 194)
"Assume the same pre-cost Sharpe but account for differing trading costs to adjust forecasted Sharpe ratios." (p. 194)
94/ "The rules in my own system have holding periods between four days and a couple of months. As rules get slower than that, performance does start to worsen, and I exclude those rules entirely.
"You should do your own bootstrapping with realistic costs to check." (p. 194)
"You should do your own bootstrapping with realistic costs to check." (p. 194)
95/ "If you have multiple trading rules, you need to work out the trading turnover coming from your combined forecast. Take the weighted average of the turnover per year for each individual rule, then multiply this by the forecast diversification multiplier." (p. 196)
96/ "A turnover of 0.4 round trips per year is the lowest a passive asset-allocating investor can achieve without slowing down the estimate of price volatility [used for volatility targeting] beyond the maximum recommended lookback window of 20 weeks." (p. 196)
97/ "The extra costs of owning less liquid instruments are often outweighed by higher profits.
"More expensive-to-trade instruments usually perform better even once costs are taken into account, but only if they're traded relatively slowly (turnover <15 round trips/year).
"More expensive-to-trade instruments usually perform better even once costs are taken into account, but only if they're traded relatively slowly (turnover <15 round trips/year).
98/ "The improvement in performance for illiquid instruments usually isn't strong enough to warrant a higher allocation, but it does mean that under-weighting them doesn't make sense.
"Unless bootstrapping tells you differently, assume the same pre-cost Sharpe ratio." (p. 198)
"Unless bootstrapping tells you differently, assume the same pre-cost Sharpe ratio." (p. 198)
99/ "My research shows no evidence that systematic profit targets work consistently. Most markets exhibit trending behavior (with positive skew), and a profit target will get you out of trends too early." (p. 213)
Thread with links to related research:
Thread with links to related research:
100/ "In the closest Eurodollar delivery months, volatility is very low due to zero interest rate policies. For this reason, I recommend trading Eurodollar around three years out; much beyond that, and the liquidity starts to drop off." (p. 247)
101/ "The optimal carry calculation requires that you not trade the nearest contract but one further back. This is achievable for volatility, Eurodollars, and corn. However, for bond, equity, & FX futures, you'll need to trade the nearest contract for liquidity reasons." (p. 247)
102/ "I trade three years out in Eurodollar. For V2X, I trade the second contact. For corn, I always trade the December contract to avoid seasonal effects, and I usually roll to the following year by summer. There's a longer discussion about optimal rolling on my blog." (p. 247)
103/ "I strongly recommend that you use at least three of the moving average variations for trend following, as there is insufficient evidence to say that one or two of these variations is better than the others." (p. 248)
More is generally better:
More is generally better:
104/ "A good systematic trader is humble, underestimating intelligence, skill, and luck. Assume your trading will go badly; be prepared for that, and be pleasantly surprised if it doesn't. Don't try anything too clever: it is probably unnecessary and is more likely to go wrong.
105/ "Use simple trading rules that have not been overfitted or even fitted at all. The handcrafting method of portfolio optimization is both simple and effective.
"Be skeptical. Don't trust anybody.
"Be skeptical. Don't trust anybody.
106/ "Be pessimistic. Don't trust backtets, even if you haven't overfitted them, and even if they've been done on a rolling out-of-sample basis. The future is unliekly to be quite as good as the past.
107/ "A highly diversified system is unlikely to beat a Sharpe ratio of 1.0. If you're a discretionary trader or have a static portfolio, then be even more pessimistic and assume Sharpe ratios of 0.5 and 0.4, respectively. You may do better, but you shouldn't expect to.
108/ "If you expect to make steady gains with very few losses, there is a good chance you have a negative skew style which hasn't yet blown up but probably will eventually. Adjust your volatility target accordingly.
"Be thoughtful. Understand your markets and your trading rules.
"Be thoughtful. Understand your markets and your trading rules.
109/ "At some point, some instruments or trading rules will go badly wrong. Limit your exposure to this by trading the most diversified set of instruments and rules that you can. Stay away from very low volatility instruments: they're expensive to trade and dangerous.
110/ "The best traders are diligent when creating their systems but lazy when running them. Put the hard work into designing a system you are comfortable with. Make a commitment: don't meddle, improve, or risk-manage. These time-consuming activities usually destroy performance.
111/ "Finally, to make money, you need to be lucky. Even if you do everything right, you could still be unprofitable if chance turns against you.
"You can't entirely eliminate risk, but you should quantify it and make sure you can cope with the likely downside." (p. 259)
"You can't entirely eliminate risk, but you should quantify it and make sure you can cope with the likely downside." (p. 259)