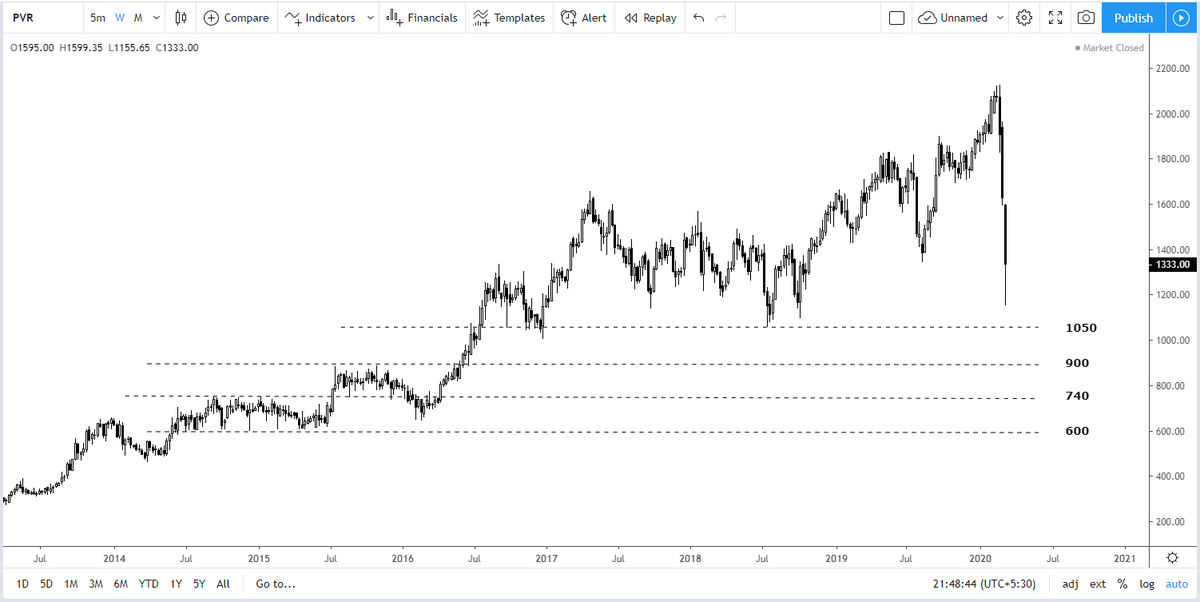
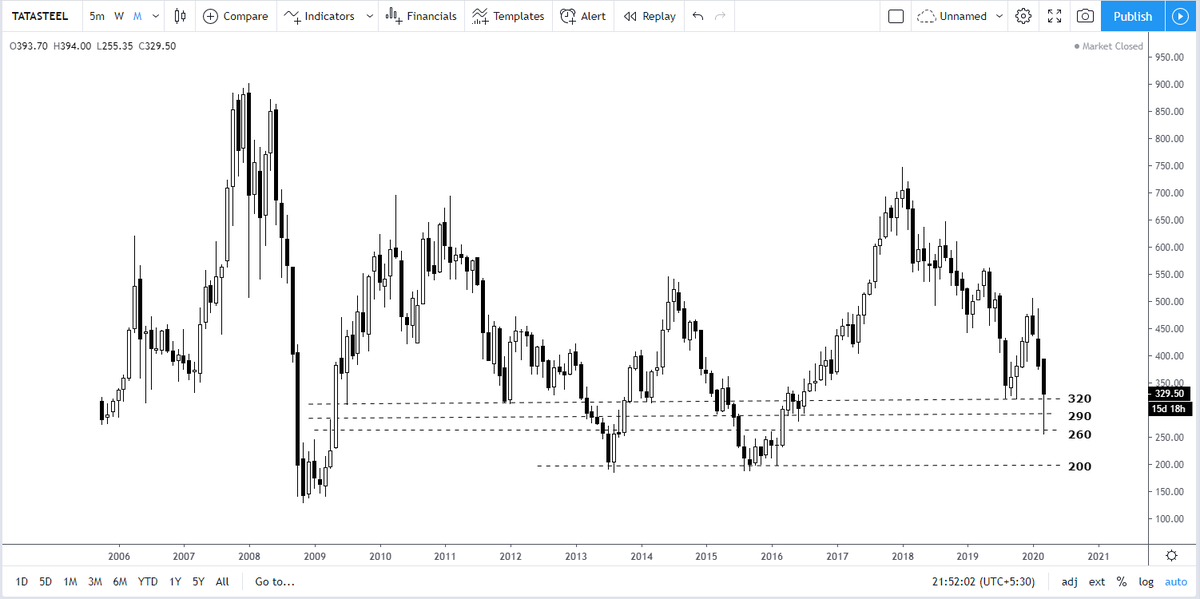
Posting investment levels for a few good stocks. Not quite sure which levels we will get - totally depends on the market. But, one can add 25% of the planned quantity at each level. Define your risk first. 1/n

#Investing #Trendlines #Affle #Creditaccess #Dmart #Siemens ImageImageImageImage

• • •

Missing some Tweet in this thread? You can try to force a refresh
 

Keep Current with Trendline Investor

Trendline Investor Profile picture

Stay in touch and get notified when new unrolls are available from this author!

Read all threads

This Thread may be Removed Anytime!

PDF

Twitter may remove this content at anytime! Save it as PDF for later use!

Try unrolling a thread yourself!

how to unroll video
  1. Follow @ThreadReaderApp to mention us!

  2. From a Twitter thread mention us with a keyword "unroll"
@threadreaderapp unroll

Practice here first or read more on our help page!

More from @dmdsplyinvestor

Sep 24
Technical Analysis 101🎯

6 Powerful & Simple Price action strategies...📉

...to easily spot the Beginning/End of an UpTrend/Downtrend

...in all timeframes & Markets!💹

Ready to Learn?🤓
Let’s go…🧵 Image
1 -> A Trend Persists until Its Reversal Is Indicated

- In Dow Theory, a trend is assumed to persist until there is evidence to the contrary

- Trend changes are identified by a penetration of a previous significant High or Low
2 -> How to identify the end of an uptrend?📈

There are basically 3⃣ types of reversal formations that will signal a change in the direction from uptrend to downtrend

✅ Failure Swing
✅ Non-Failure Swing
✅ Double Top sell

Let's look at them in detail!👀

Save this Image👇 Image
Read 14 tweets
Sep 3
MY TRADINGVIEW SETUP - Explained! 🧵

In this 🧵, I cover
- Indicators I use in Tradingview
- Settings for the indicators I use
- Why do I use these Indicators & Settings

Ready to know what I use?...

Let’s go...😃 Image
1 -> Commodity Channel Index(CCI) Indicator to assess Bullishness

- In short, it is a momentum indicator
- Above 100, indicates bullishness
- Below -100, indicates bearishness

If you do not know what CCI indicator is, watch this video 👇
1.1 -> Which CCI indicator to use in Tradingview? 😅

- Search for the inbuilt Commodity Channel Index in 'Technicals' section

- Go to settings -> Inputs -> Length - change this to 34 from default 20

Refer to this video for details👇
Read 12 tweets
Aug 26
Fake breakouts & how to navigate them!🤔

A detailed thread!🧵
1⃣ Cardinal rule: Stop chasing breakouts...

- If everyone is talking about it on social media and it has already broken out
- If a stock has moved up already for the last few days
- If a stock is up more than 10% already from breakout zone
- If your SL is deep Image
2⃣ Enter only on breakout & nowhere else if you're trading breakouts...

Buy only…
- above breakout zones (no entry in no-man land)
- above a key resistance zone after a stock consolidates
- 1-2% above resistance zone
- Identify entry points(set alerts on TV/set GTT in zerodha) Image
Read 9 tweets
Aug 17
Stan's Secret to Identify Multibaggers!🤫

'The Triple Confirmation Pattern'!

Ready to Learn?🤓

Let's go...🧵 Image
This Pattern can help one spot potential Multibaggers!

I'll discuss the following in this thread...

✅ 5 easy-to-follow rules
✅ Essential indicators to use
✅ Scanners to use
Rule 1: Weekly Price must be above the 30 week Moving average(MA)💹

- Why 30? It is just a number & considers last 30 weeks

- Try to consider at least 6 months/26 weeks. With EMA, long term trend changes are easy to spot

- You can use simple MA/EMA/WMA as well Image
Read 11 tweets
Aug 12
A FREE Comprehensive Technical Analysis course with...
✅ 8 Modules
✅ 40 Lessons

Protect your hard-earned money & make it grow!🏆
Read on🧵... Image
I. Introduction to Trading Concepts

1. Tradingview for Charting


2. All about Candlesticks
https://t.co/Uk9gdwWqSZ

3. Log vs Linear charting
https://t.co/Rwu5uhXKsB

4. All About Trendiness
https://t.co/h6UB9sbSmv


5. Support & Resistances


6. Best Timeframe to use
https://t.co/hb4H7MCcyh
Read 15 tweets
Aug 5
This STRATEGY might change your Trading approach forever!

📈TRADING using MULTIPLE TIMEFRAMES (MTF)📈

A Top-down Trading approach that will increase your chances of winning...

Ready to learn?🧵...

Let’s go... Image
Rule 1⃣: Define your Trading/Investing Style

You can be a
➡️ Long term investor
➡️ Positional trader
➡️ Swing trader
➡️ Intraday trader

Let's take the example of a Positional trader for this 🧵
Rule 2⃣: Identify the LONG TERM TREND on Monthly charts!

The long term chart helps you identify the long term trend & pivotal points in trend changes

In the below #NEULAND chart, you can see the stock has been in a long term uptrend since 2001.
Read 9 tweets

Did Thread Reader help you today?

Support us! We are indie developers!


This site is made by just two indie developers on a laptop doing marketing, support and development! Read more about the story.

Become a Premium Member ($3/month or $30/year) and get exclusive features!

Become Premium

Don't want to be a Premium member but still want to support us?

Make a small donation by buying us coffee ($5) or help with server cost ($10)

Donate via Paypal

Or Donate anonymously using crypto!

Ethereum

0xfe58350B80634f60Fa6Dc149a72b4DFbc17D341E copy

Bitcoin

3ATGMxNzCUFzxpMCHL5sWSt4DVtS8UqXpi copy

Thank you for your support!

Follow Us on Twitter!

:(