
LEARNING POST:
DEMAND-SUPPLY ZONE
In this is post I will make an attempt to explain DEMAND - SUPPLY ZONE. Before we proceed some basic idea about DEMAND-SUPPLY.
1. DEMAND > SUPPLY: Price will RISE
2. SUPPLY > DEMAND: Price will FALL
3. SUPPLY = DEMAND: Price will CONSOLIDATE
DEMAND-SUPPLY ZONE
In this is post I will make an attempt to explain DEMAND - SUPPLY ZONE. Before we proceed some basic idea about DEMAND-SUPPLY.
1. DEMAND > SUPPLY: Price will RISE
2. SUPPLY > DEMAND: Price will FALL
3. SUPPLY = DEMAND: Price will CONSOLIDATE
When the price RISES/FALLS there is an IMBALANCE which is created and if in this IMBALANCE DEMAND > SUPPLY then you will see PRICE WILL RISE. On the contrary if in this IMBALANCE SUPPLY > DEMAND then you will see PRICE WILL FALL.
There will a point of time when the MARKET WILL REACH AN EQUILIBRIUM POINT that is the point where DEMAND = SUPPLY and the PRICE starts CONSOLIDATING or the PRICE will start moving in a RANGE
Cont..
Cont..
Thus always remember after every IMBALANCE move there will a BALANCE move and also after BALANCE move there will an IMBALANCE move 

Now talking about DEMAND - SUPPLY ZONES these zones are broadly divided in TWO ZONES:
1. REVERSAL ZONES
2. CONTINUATION ZONES
Reversal Zones are formed with RALLY-BASE-DROP & DROP-BASE-RALLY
Continuation Zones are formed with DROP-BASE-DROP & RALLY-BASE-RALLY
1. REVERSAL ZONES
2. CONTINUATION ZONES
Reversal Zones are formed with RALLY-BASE-DROP & DROP-BASE-RALLY
Continuation Zones are formed with DROP-BASE-DROP & RALLY-BASE-RALLY
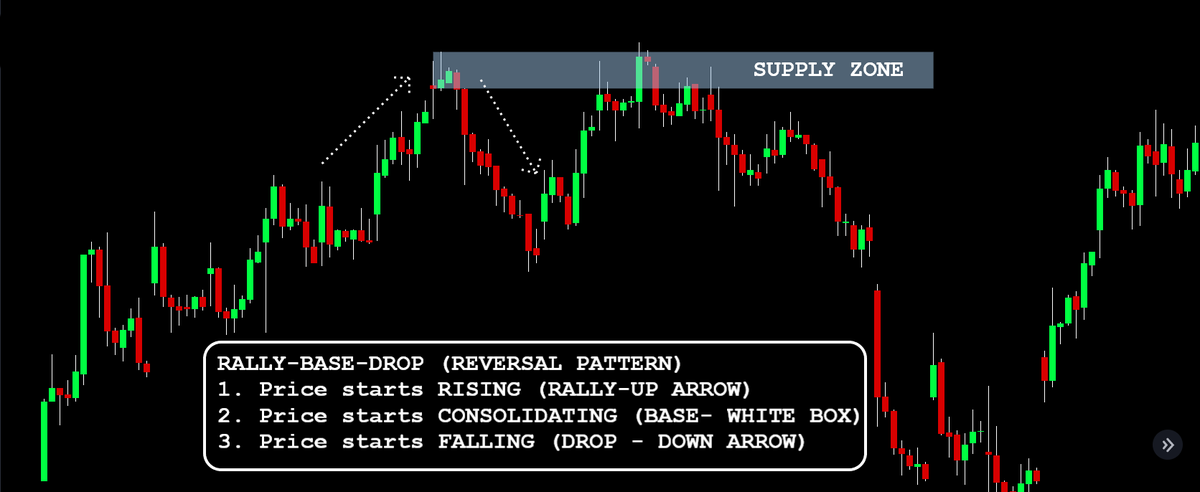
1. RALLY - BASE - DROP (REVERSAL PATTERN)
This forms a POTENTIAL SUPPLY ZONE
This forms a POTENTIAL SUPPLY ZONE
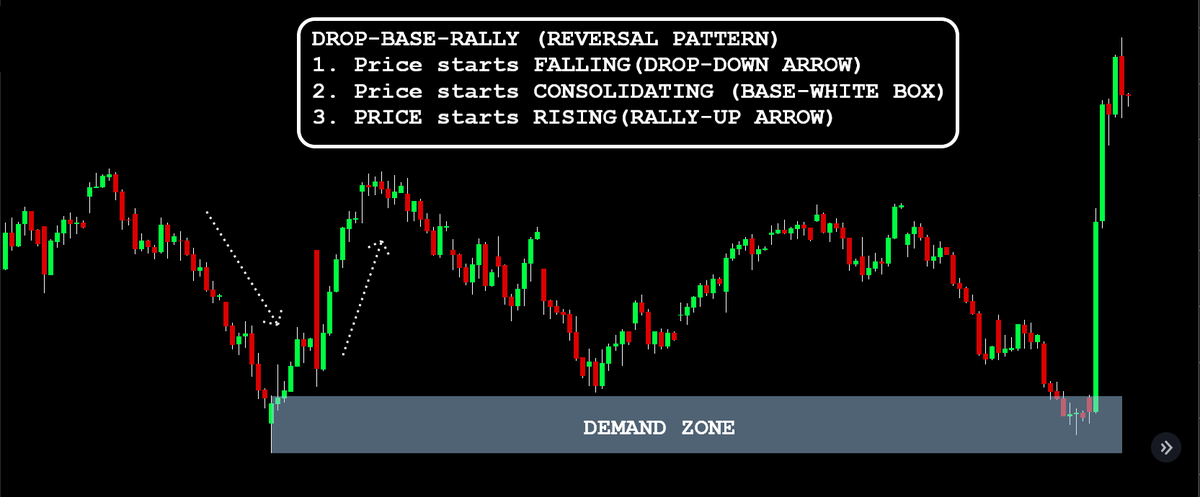
2. DROP - BASE - RALLY (REVERSAL PATTERN)
This forms a POTENTIAL DEMAND ZONE
This forms a POTENTIAL DEMAND ZONE
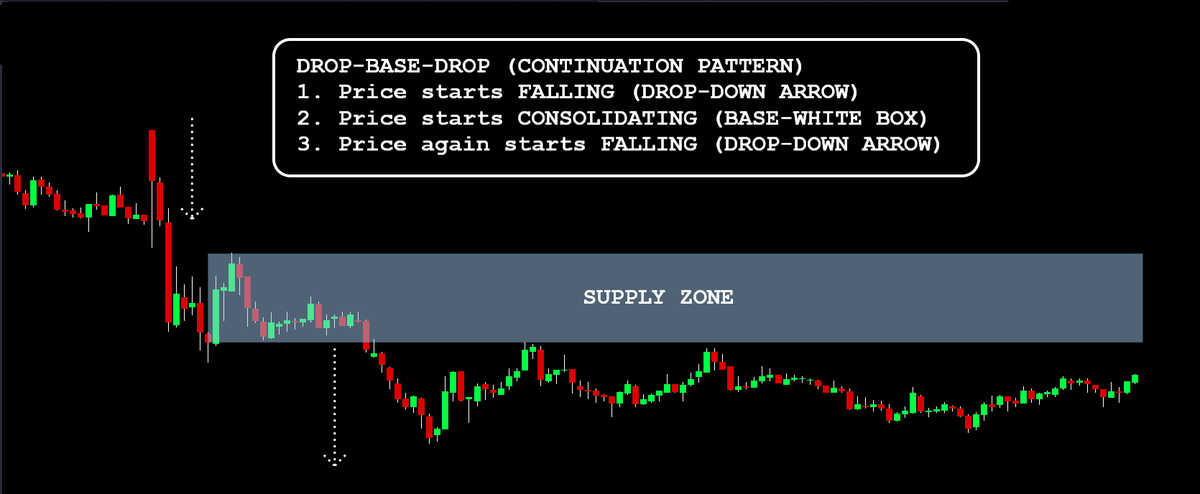
3. DROP - BASE - DROP (CONTINUATION PATTERN)
This forms a POTENTIAL SUPPLY ZONE
This forms a POTENTIAL SUPPLY ZONE
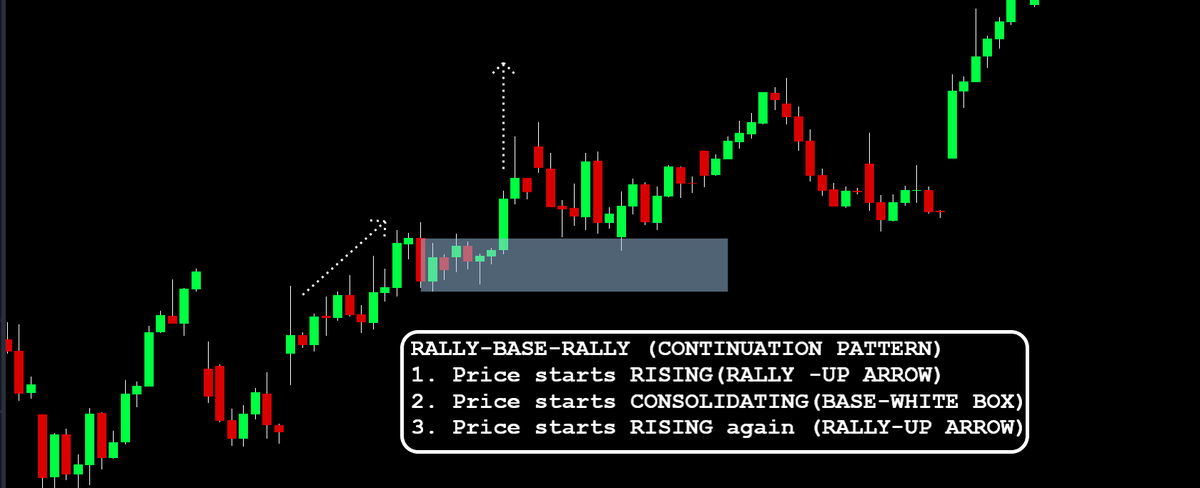
4. RALLY - BASE - RALLY (CONTINUATION PATTERN)
This forms a POTENTIAL DEMAND ZONE
This forms a POTENTIAL DEMAND ZONE
Next once you are up with the basics of DEMAND-SUPPLY ZONE lets make an attempt to check one of its variant which is referred as an ORDER BLOCKS
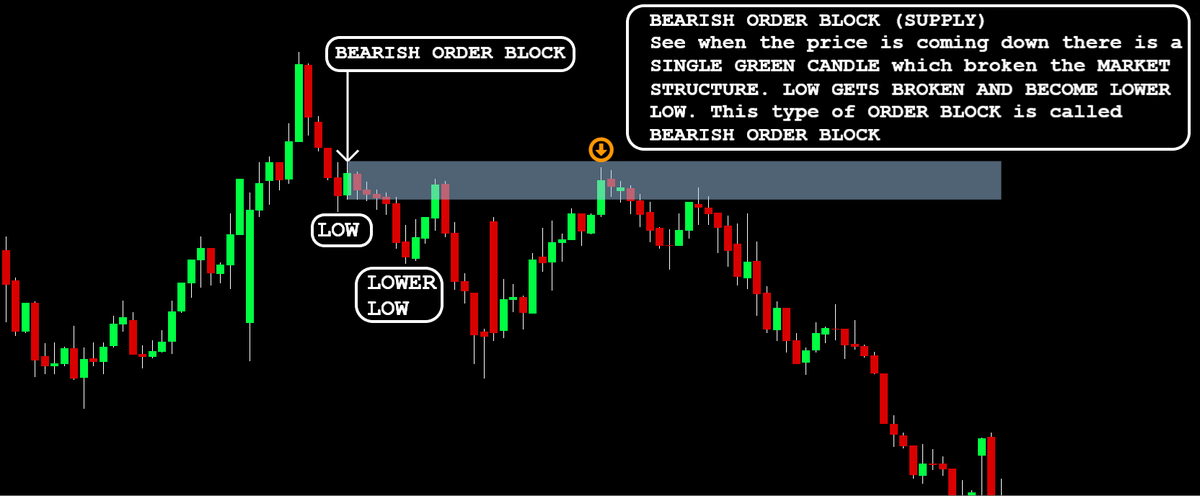
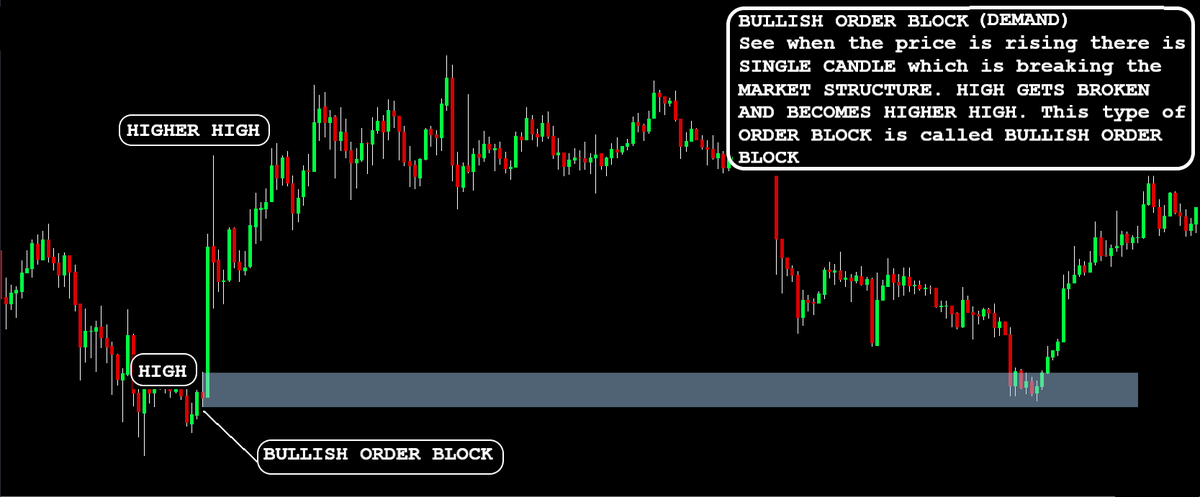
ORDER BLOCKS are much more POWERFUL and improves the success ratio because these are SINGLE CANDLES which rule the whole setup.
ORDER BLOCKS are much more POWERFUL and improves the success ratio because these are SINGLE CANDLES which rule the whole setup.
There are two types of ORDER BLOCKS:
1. BEARISH ORDER BLOCK
2. BULLISH ORDER BLOCK
See the images for better understanding
1. BEARISH ORDER BLOCK
2. BULLISH ORDER BLOCK
See the images for better understanding
For those who are facing problem in marking the DEMAND-SUPPLY ZONE.
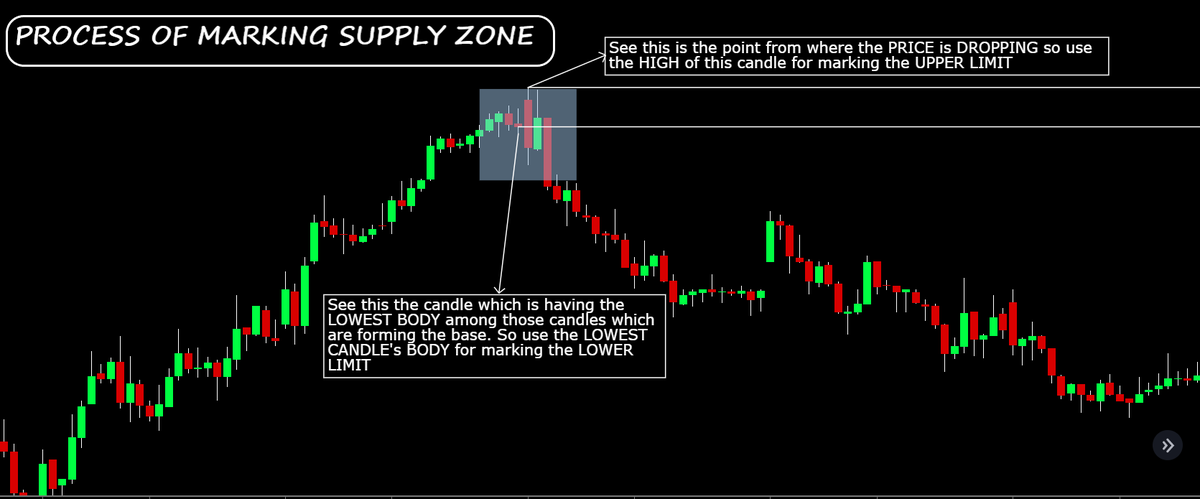
SUPPLY ZONE: Use the following two things to mark the UPPER LIMIT - LOWER LIMIT ( they are called PROXIMAL AND DISTAL LINES)
1. HIGH OF THE CANDLE
2. LOWEST BODY OF THE CANDLE
SUPPLY ZONE: Use the following two things to mark the UPPER LIMIT - LOWER LIMIT ( they are called PROXIMAL AND DISTAL LINES)
1. HIGH OF THE CANDLE
2. LOWEST BODY OF THE CANDLE
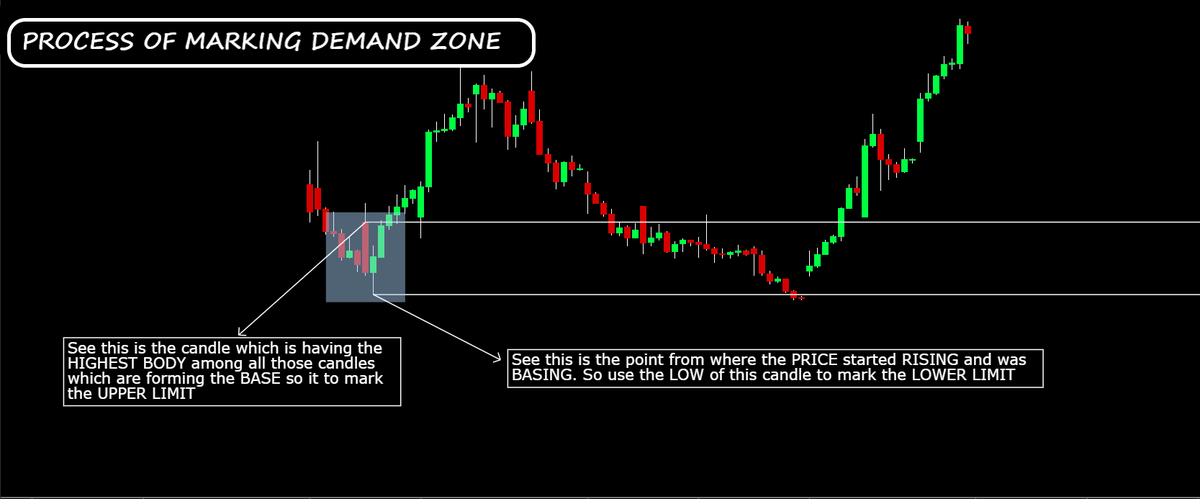
DEMAND ZONE: Use the following two things to mark the UPPER LIMIT - LOWER LIMIT ( they are called PROXIMAL AND DISTAL LINES)
1. LOW OF THE CANDLE
2. HIGHEST BODY OF THE CANDLE
1. LOW OF THE CANDLE
2. HIGHEST BODY OF THE CANDLE
Now up to this level everything must be known to many but the problem which most of us face is in understanding the power of the zone or how much valid the zone is for taking any trade.
Cont..
Cont..
In order to determine the strength of any DEMAND-SUPPLY ZONE always check "ARRIVAL TO & DEPARTURE FORM THE ZONE"
If you are able to see the following characteristics in any ZONE then you can mark it as a STRONG ZONE.
Cont..
If you are able to see the following characteristics in any ZONE then you can mark it as a STRONG ZONE.
Cont..
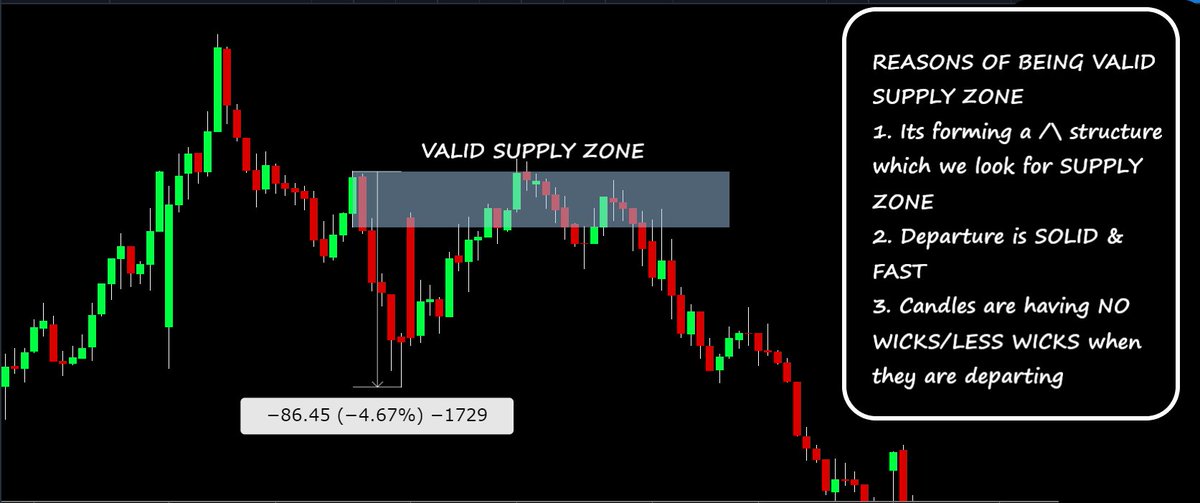
1. Look for the OVER ALL STRUCTURE (DEMAND -V & SUPPLY /\)
2. Departure should be always SOLID AND FAST (because if the departure is SLOW & SLUGGISH then its very much possible that the zone will not HOLD)
3. Candles which are forming should have NEGLIGIBLE -NIL WICKS
Cont...
2. Departure should be always SOLID AND FAST (because if the departure is SLOW & SLUGGISH then its very much possible that the zone will not HOLD)
3. Candles which are forming should have NEGLIGIBLE -NIL WICKS
Cont...
VALID SUPPLY ZONE. You can use this idea and mark out VALID DEMAND ZONE
Now few things before I conclude the whole post
1. If you are confused about TIME FRAME then look for HIGHER TIME FRAMES (WEEKLY - DAILY - HOURLY)
2. If a DEMAND ZONE - SUPPLY ZONE is formed then try to take the trade when it coming back into that zone for the first time
Cont..
1. If you are confused about TIME FRAME then look for HIGHER TIME FRAMES (WEEKLY - DAILY - HOURLY)
2. If a DEMAND ZONE - SUPPLY ZONE is formed then try to take the trade when it coming back into that zone for the first time
Cont..
3. If the DEMAND - SUPPLY ZONE is tested multiple times then it will become weak and may not work
4. Use this DEMAND-SUPPLY ZONE in confluence with KEY LEVELS it will be helpful in giving more accurate trades
5. Always take your trades in BASE with SL (above/below) the BASE
4. Use this DEMAND-SUPPLY ZONE in confluence with KEY LEVELS it will be helpful in giving more accurate trades
5. Always take your trades in BASE with SL (above/below) the BASE
If you have found this POST "WORTHY" then please RE-TWEET
HAPPY LEARNING - HAPPY TRADING
With Regards,
Siddharth
HAPPY LEARNING - HAPPY TRADING
With Regards,
Siddharth
• • •
Missing some Tweet in this thread? You can try to
force a refresh


