𝗦𝗶𝗱𝗱𝗵𝗮𝗿𝘁𝗵 Profile picture
In Trading / Investing - Price Action Over Everything Tweets are for 'Educational' purpose RT ≠ ENDORSMENT
Jitendra Jain Profile picture Arun Profile picture Gajendra Dublish Profile picture SILEN LAW Profile picture ahm ❤️ .plena block $BUBBLE Profile picture 5 subscribed
Feb 13, 2022 12 tweets 4 min read
How about 👇

"101 SMART-MONEY CONCEPTS"

No. of likes and retweets decide the same
#priceaction SMC - 1
As promised I will share some general ideas about SMART-MONEY CONCEPTS, consider this as the first installment of that.

In this, I will discuss the following
⚡How to assess the HTF structure?
⚡How to develop a directional bias?
⚡How to refine your entry-exits? Image
Jun 25, 2021 12 tweets 3 min read
In this market environment, I think we all are encountering one simple problem. Breakouts are fizzling out so don't you think that we should have at least one method by which we can handle such fizzled breakouts and trade in the opposite direction

So let's take a deep dive We all know that from failed moves come faster moves but the problem here is we just see the same happening on screen and are not able to capitalize on the same. See the below-attached image for few seconds I think you will get the tone of further discussion
Jun 24, 2021 9 tweets 3 min read
Do you want to create GOOGLE SHEET SCREENER which shows those stocks which are BREAKING OUT 20 DAY HIGH and 20 DAY LOW?

The concept propounded by SIR RICHARD DONCHIAN
Let's take a deep dive

If you find this interesting then feel free to TAG😁, LIKE👍 and RT♻ Donchain Channel is a very interesting Trend Following Tool which looks as shown below. The UPPER LINE is called UPPER BOUNDARY and the LOWER LINE is called LOWER BOUNDARY. Trades can be set up in two manners
1. Trend Continuation
2. Trend Fading(Turtle Soup - Ref. Street Smart)
May 24, 2020 7 tweets 2 min read
LEARNING POST
[Refining your ENTRIES based on MARKET STRUCTURE]

In this post I will make an attempt to share a simple but effective way of getting into TRADE with LOW RISK

If you find it interesting feel free to "RT"

So let's get started Most of the time when we want to trade LONG we generally look for a classical pattern of UPTREND i.e. HIGHER HIGH - HIGHER LOW which is the first confirmation to trade LONGS

(See the image for better understanding) Image
May 23, 2020 14 tweets 4 min read
Let's discuss about PRICE ACTION PATTERN which gets repeated again and again but that FEAR OF MISSING OUT (FOMO) over rides and people do wrong trade

In this post I will try to explain about human mindset when PRICE starts moving higher/lower
If you find this interesting
"RT" See in this image you are able to see that price is moving higher from a zone which is marked with horizontal boundaries and from there price moves up without looking back
Let say in this manner that if this much PRICE ACTION is present in front of you where you will take a trade Image
Apr 10, 2020 20 tweets 5 min read
LEARNING POST:
DEMAND-SUPPLY ZONE

In this is post I will make an attempt to explain DEMAND - SUPPLY ZONE. Before we proceed some basic idea about DEMAND-SUPPLY.

1. DEMAND > SUPPLY: Price will RISE
2. SUPPLY > DEMAND: Price will FALL
3. SUPPLY = DEMAND: Price will CONSOLIDATE When the price RISES/FALLS there is an IMBALANCE which is created and if in this IMBALANCE DEMAND > SUPPLY then you will see PRICE WILL RISE. On the contrary if in this IMBALANCE SUPPLY > DEMAND then you will see PRICE WILL FALL.
Apr 8, 2020 8 tweets 2 min read
LEARNING POST:
Normally I see many traders getting confused in deciding if its DISTRIBUTION/RE-ACCUMULATION. So let me make an attempt to explain how I panned myself in understanding the process of DISTRIBUTION.
Firstly its more important to know that every stock has FOUR PHASES Image ACCUMULATION - MARKUP - DISTRIBUTION - MARK DOWN
(Refer the image for better understanding)

After the stock has gone passed through the phase of MARKUP it will set a PEAK (POINT-A) then the stock will move down and set a TROUGH(POINT-B).
Cont..
Apr 1, 2020 6 tweets 2 min read
LEARNING POST! (Refer the image)

Whenever I come across charts I find many traders doing this mistake.
The mistake the do is when the stock starts coming down they start buying when the price comes in ZONE-1 by putting a SL around the region marked with black dotted line .. Image The price initially bounces but soon it traps and falls below the zone takes of the SL and then the trader puts a question mark on his capabilities to trade. See firstly there is nothing wrong in trading with zones I personally trade with zones but the mistake here is..
Oct 16, 2019 12 tweets 3 min read
Thread on Volume Spread Analysis (VSA) of NIFTY(SPOT) in relation to trade activity that took place on 16/10/2019

If found useful "RT"

Tagging @prodigal_trader and @ST_PYI for their reviews
#nifty50 Image 
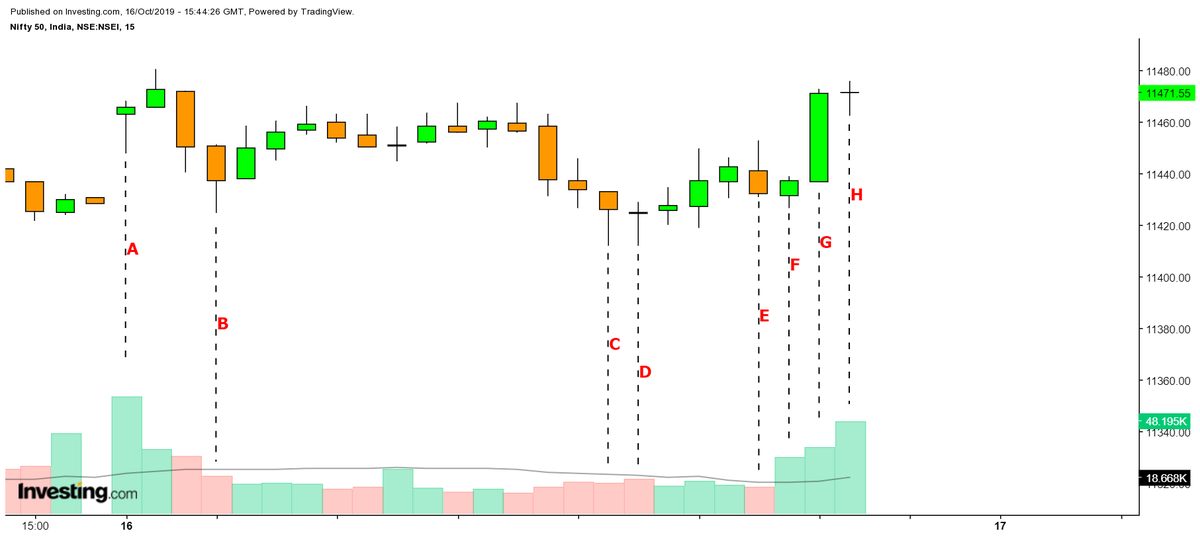
POINT-A: The day started with an UP-BAR and that too combined with GAP-UP which locked most of the traders who held SHORT trades from last trading session but remember this move was not enough because who has more money will always over-rule and thus SMART HANDS initiated "SELL"
Sep 16, 2019 7 tweets 2 min read
SOME KEY POINTERS ON OPTION CHAIN:
1. The first and foremost rule is we need to check OPTION CHAIN on DAILY basis. The prime problem with most of us is we wake up one fine morning and start analyzing by using the "STANDARD RULE" and apply the following logic PRICE ↓ OI ↓ - Long Liquidation
Price ↑ OI ↑ - Long Buildup
Price ↑ OI ↓ - Short Covering
Price ↓ OI ↑ - Short Buildup
In short most of us consider these logic as "RULE OF THUMB" but actually they are not because these STANDARD RULES work when NEW POSITIONS ARE DEVELOPED
Aug 22, 2019 8 tweets 3 min read
THREAD ON NIFTY50 ANALYSIS
Data points under consideration:
1. PCR
2. IV("NOT INDIA VIX")
3. OPEN INTEREST DATA OF NF
4. OPTION CHAIN (MONTHLY EXPIRY)

If found useful "RT"
Please don't take it as long term view I am just anticipating a bounce over here

#Nifty 1. COMPARISION OF NIFTY PCR(CURRENT EXPIRY) W/ IV
a. According to the data plotted above it being observed that PCR is constantly under falling zone it was getting stuck towards the zone of 1.3 - 1.0 and it fell below 1 today ~0.8 which means OI of CALLS>OI of PUTS Image