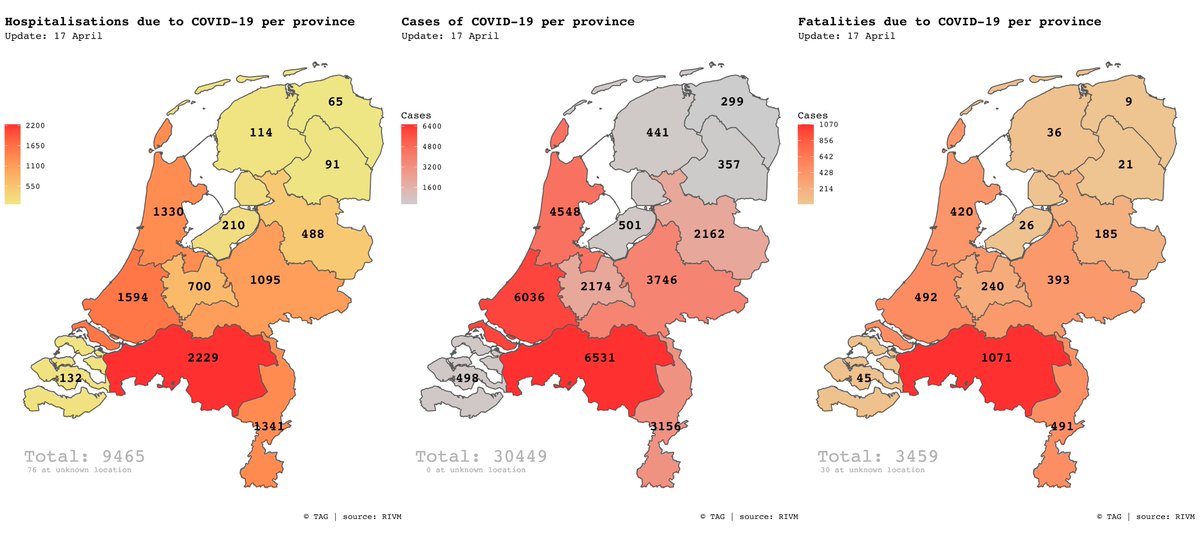
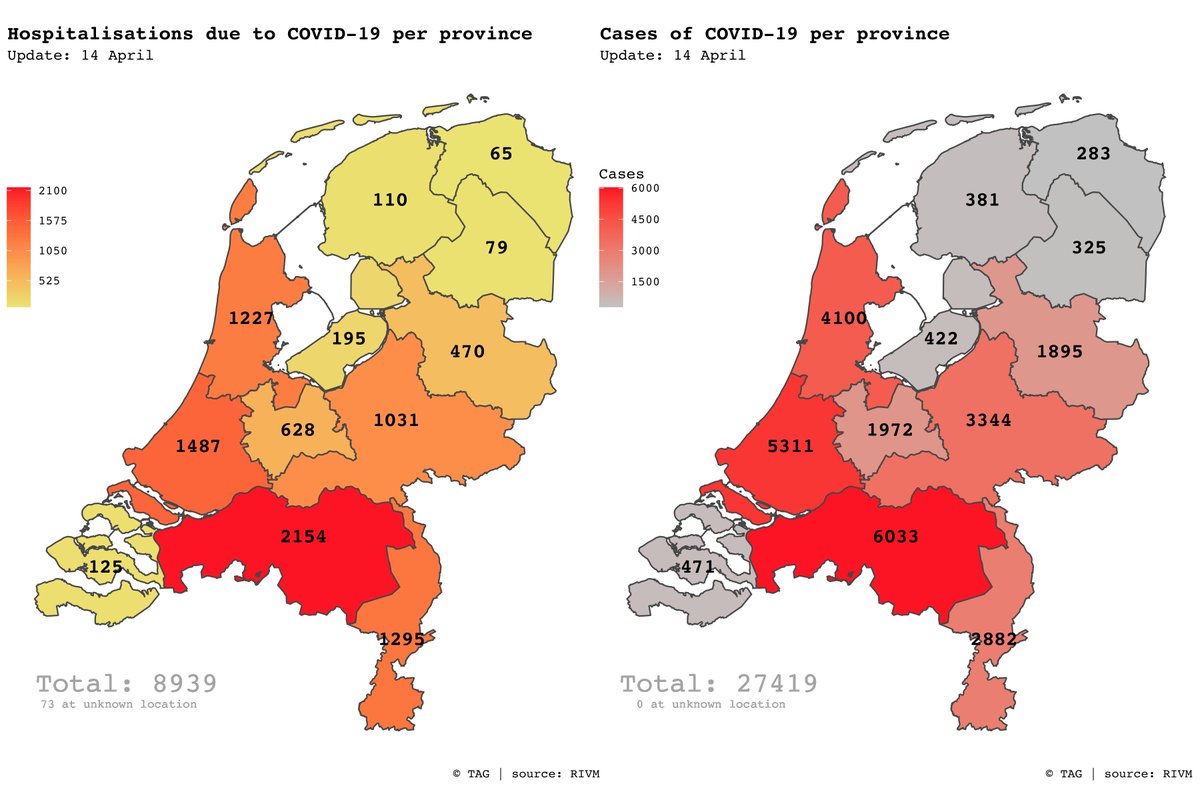
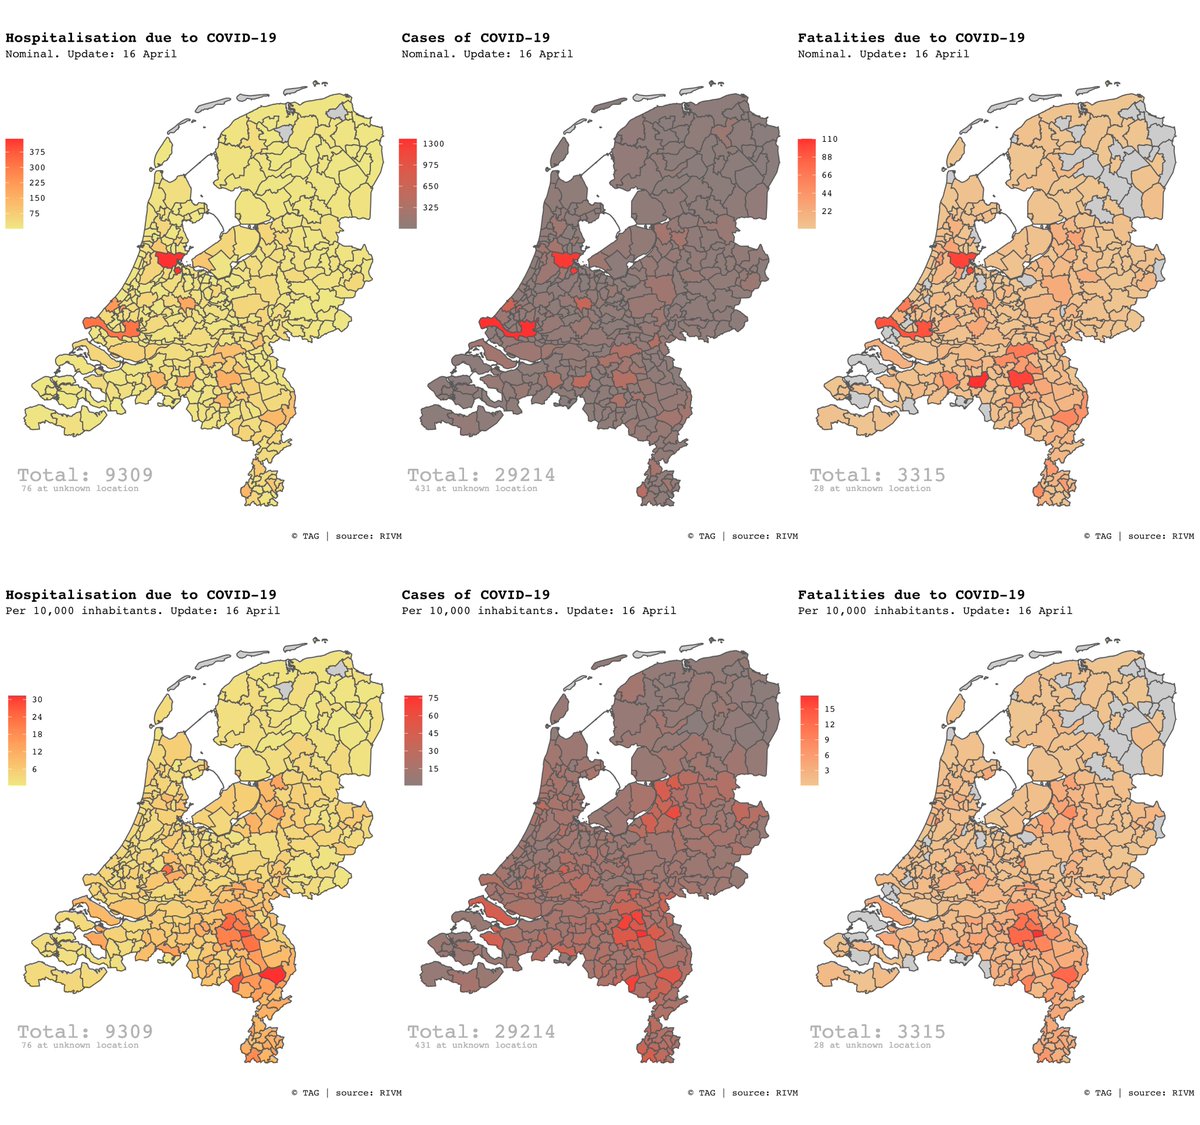
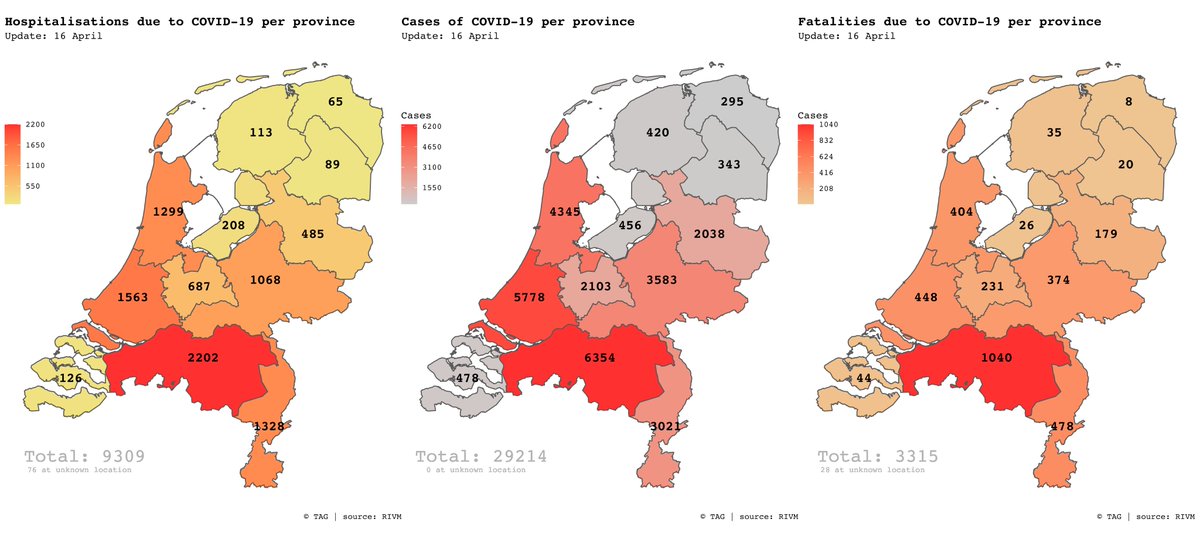
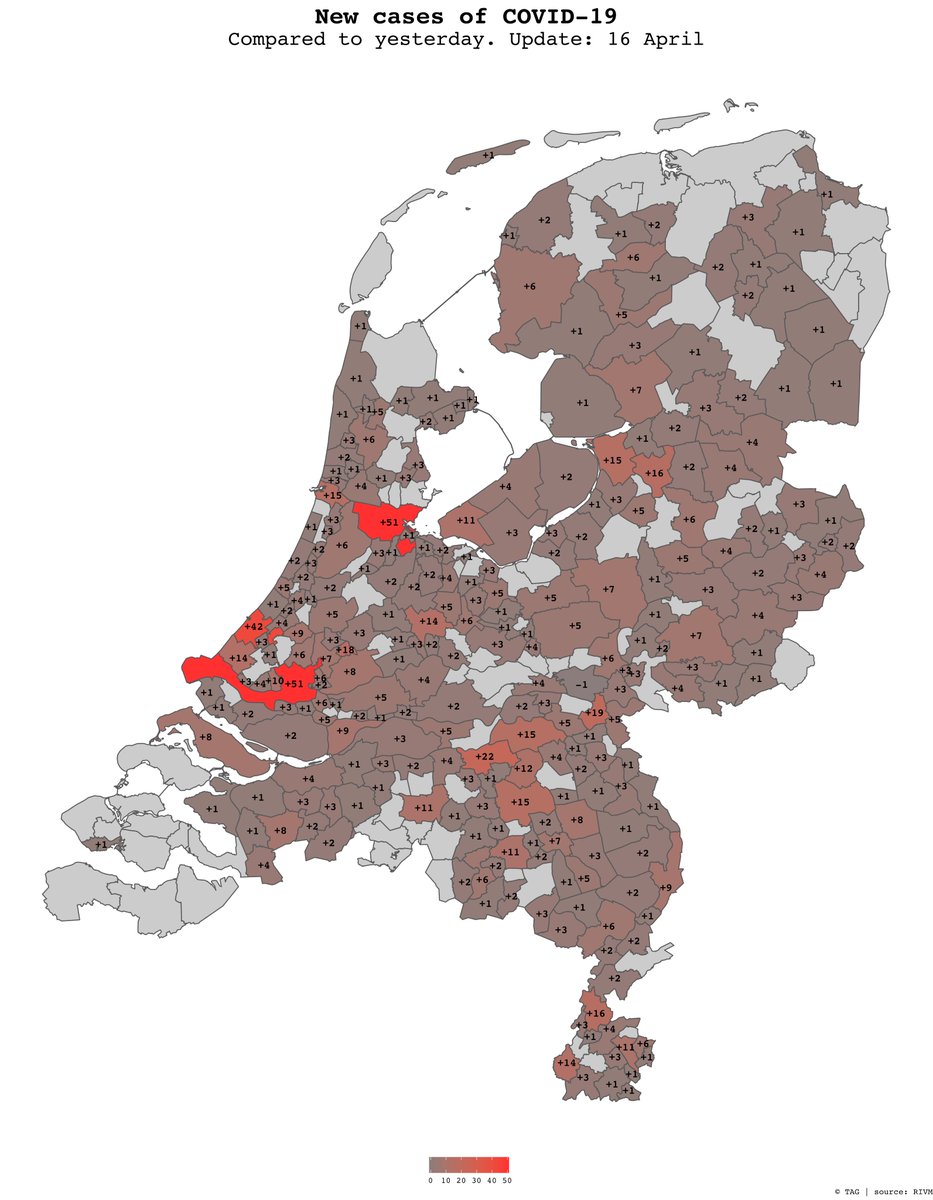
1061 new confirmed cases (total: 29.214)
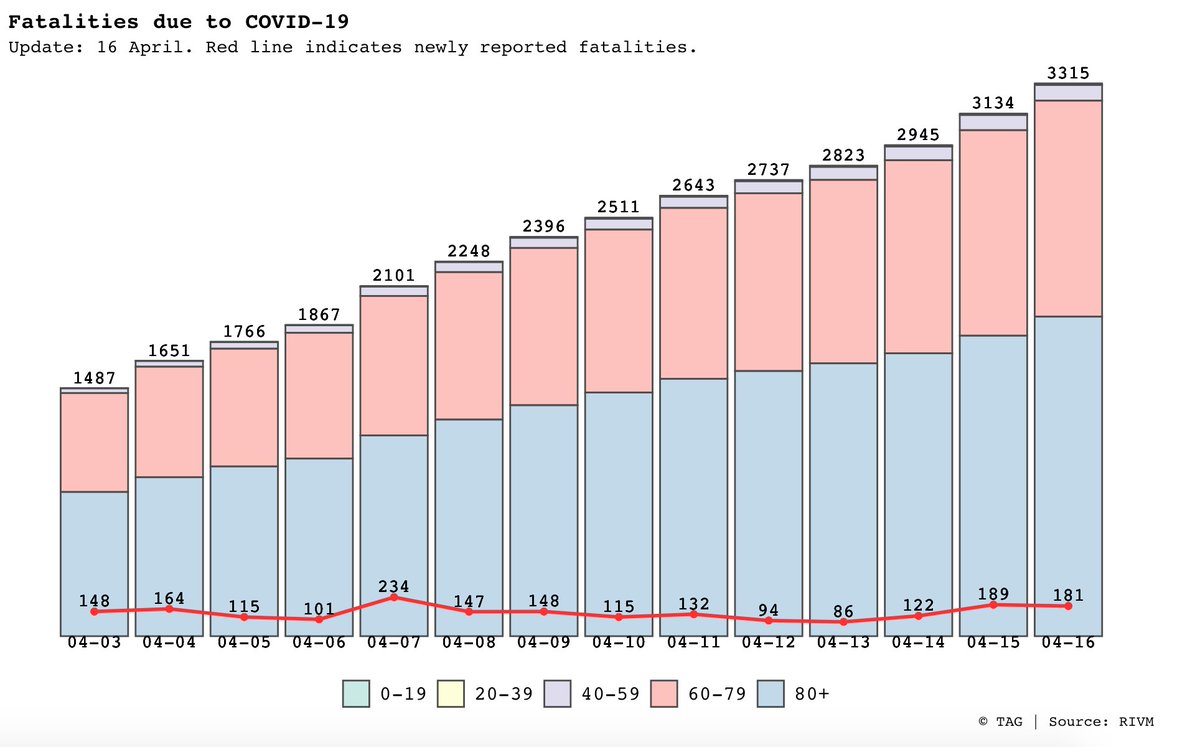
181 new fatalities (total: 3.315)
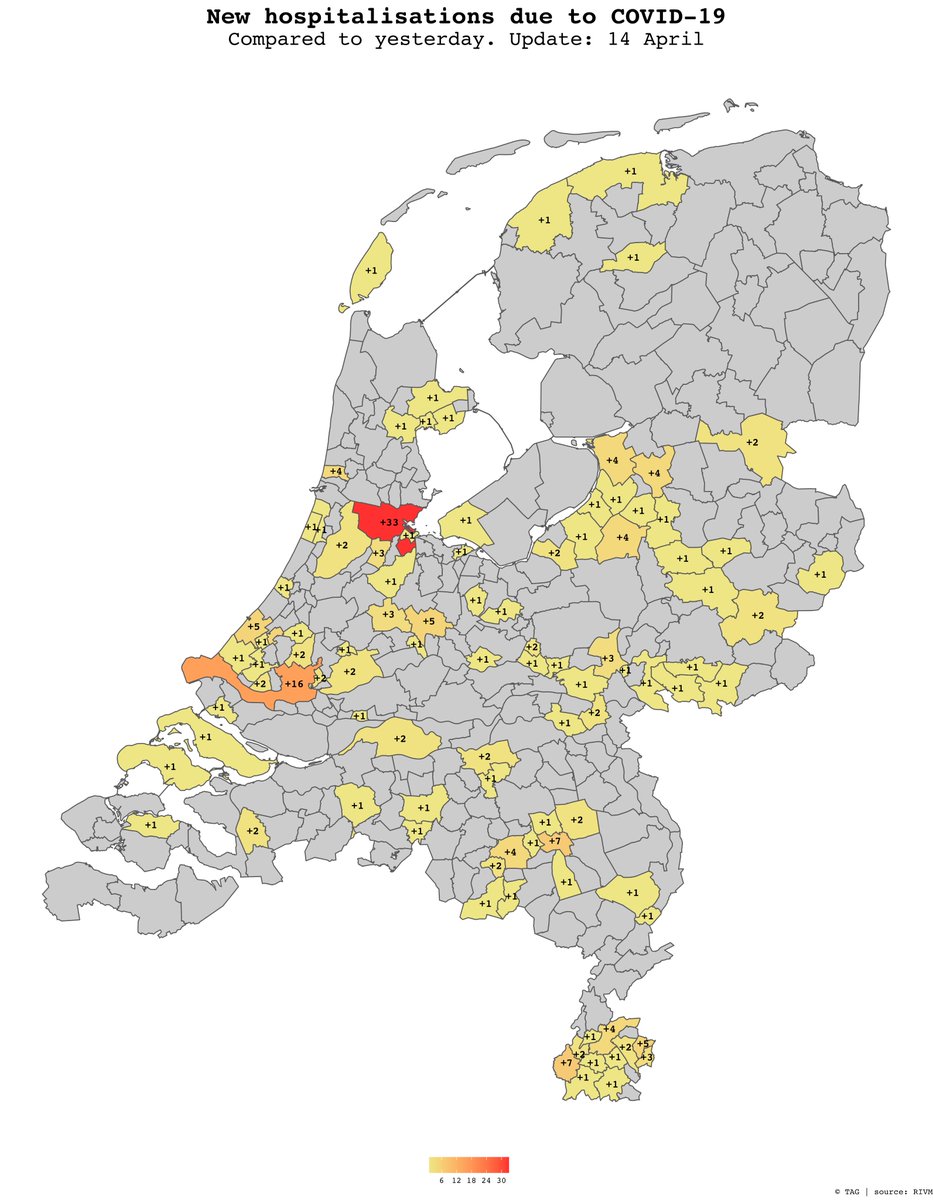
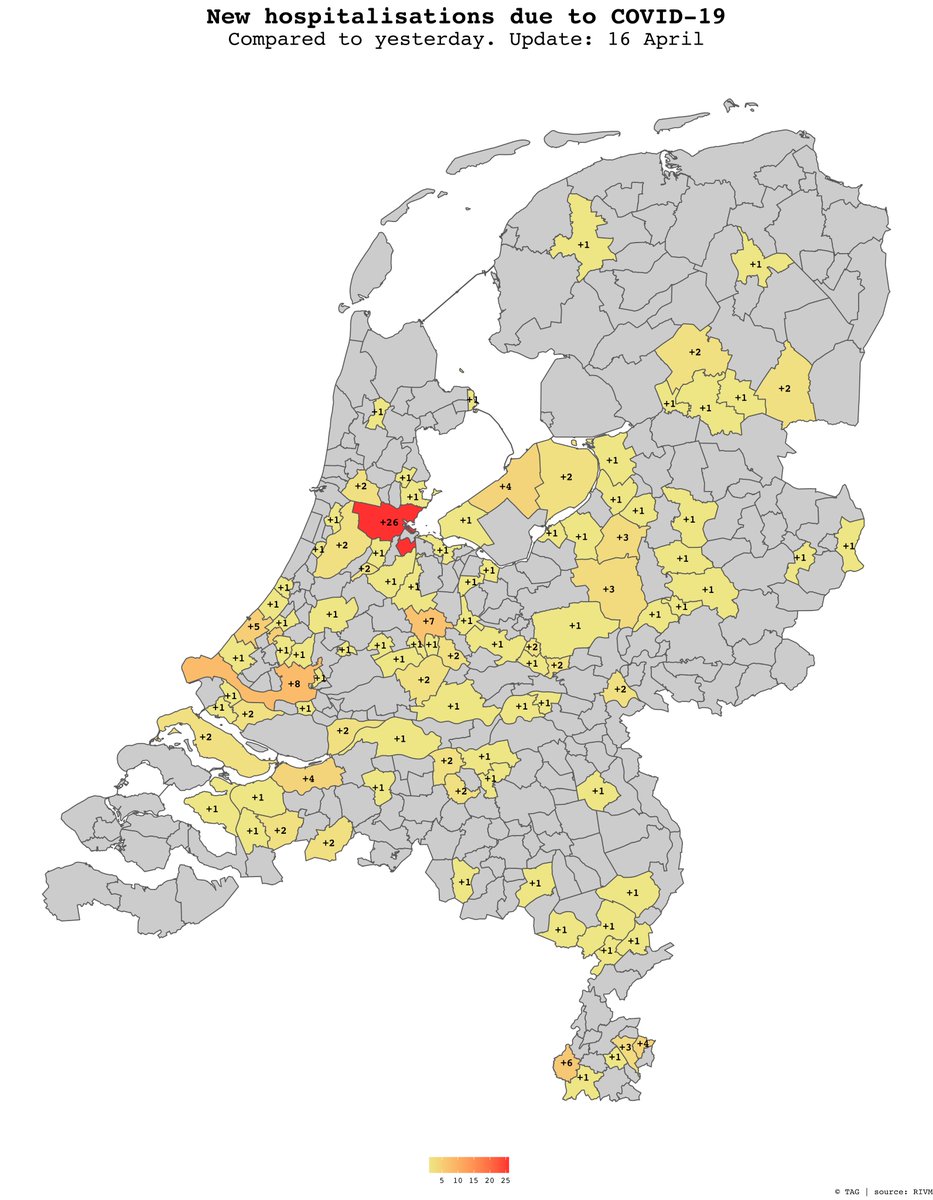
182 new hospitalisations (total: 9.309)
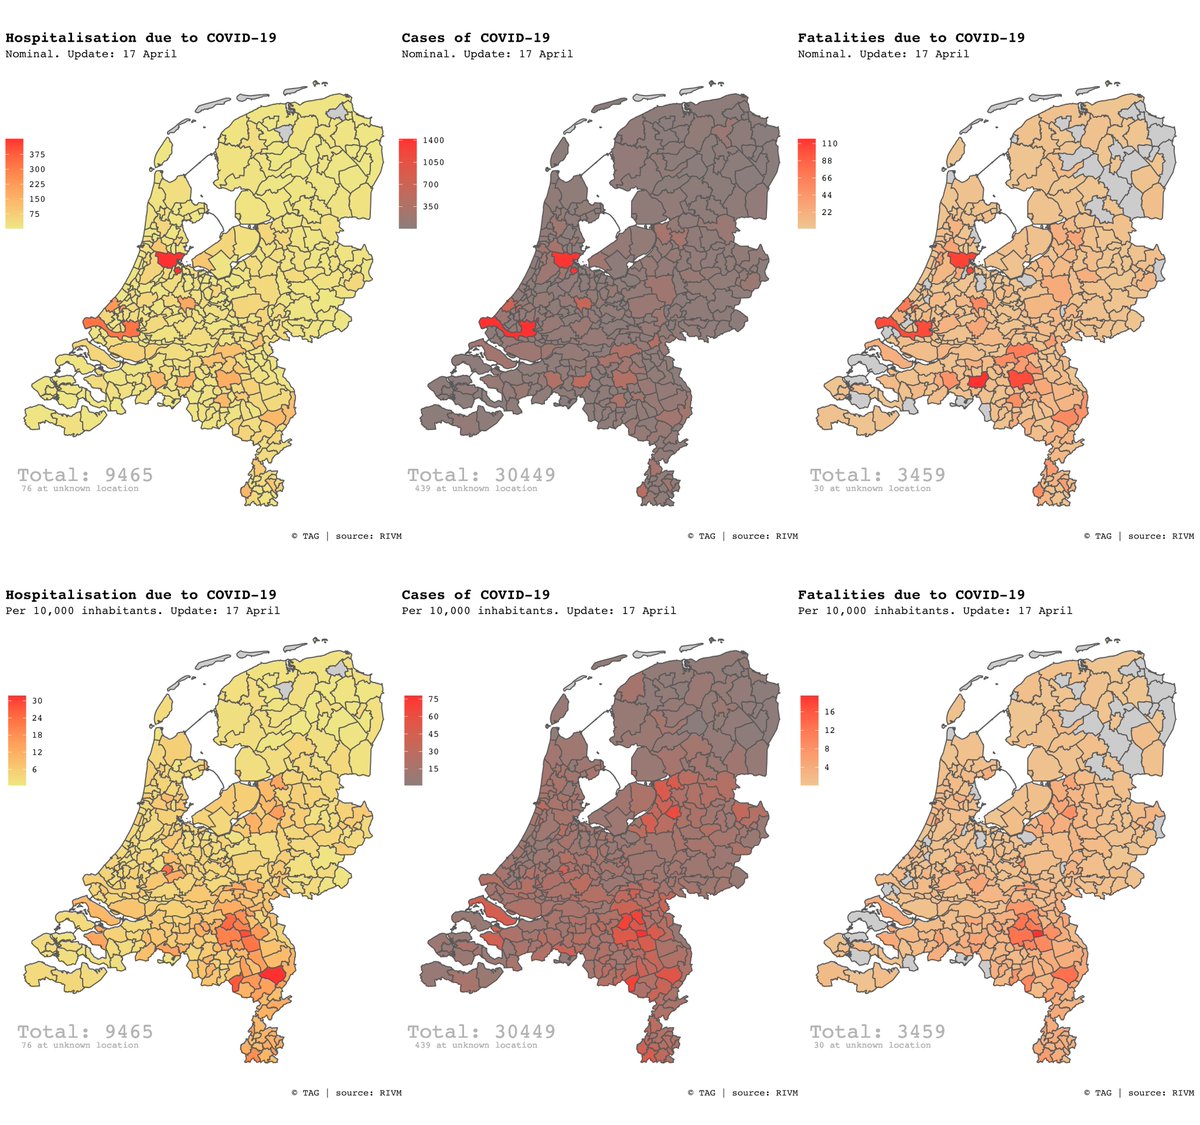
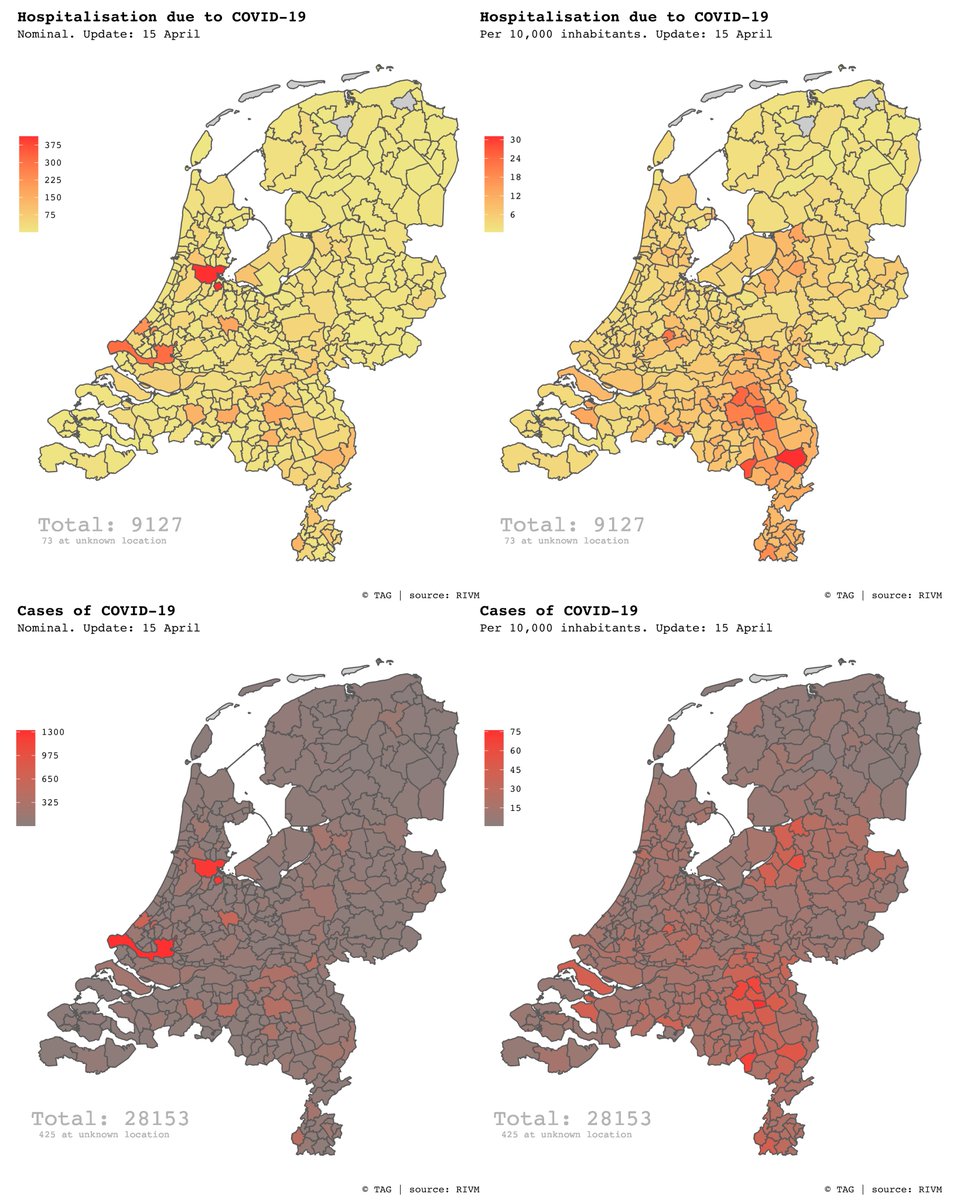
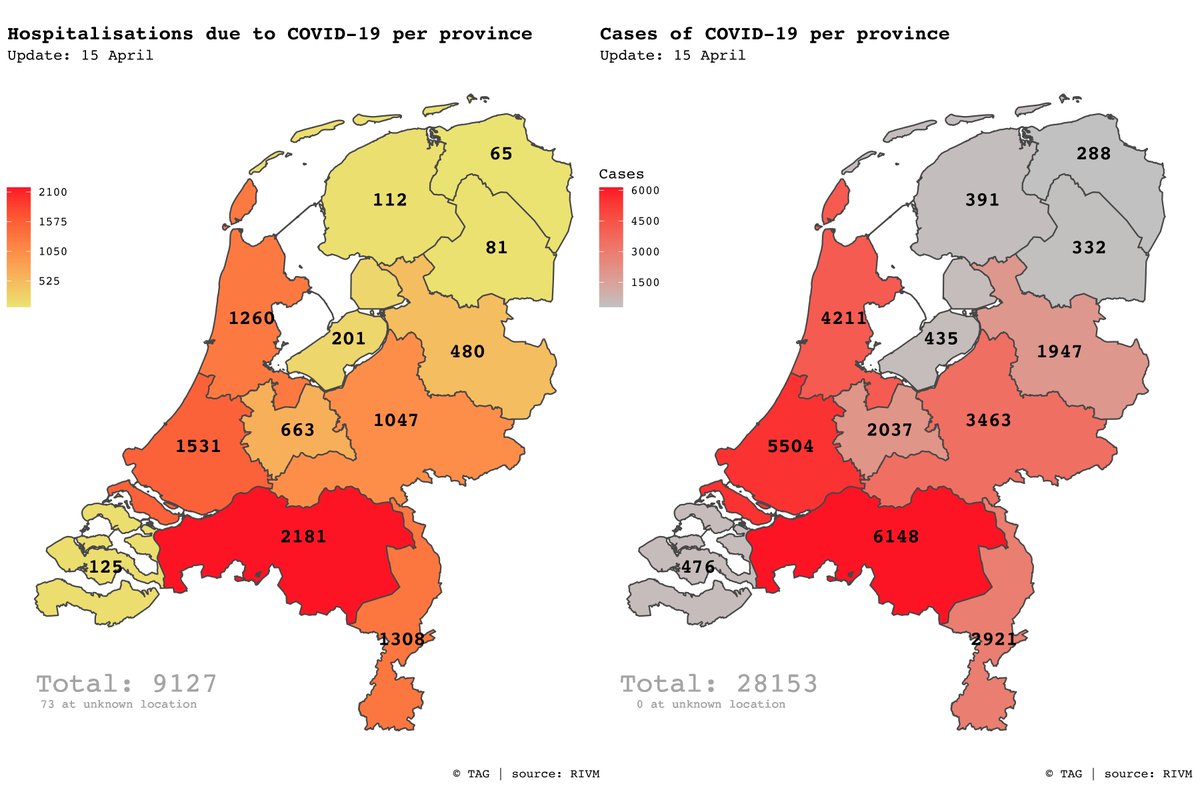
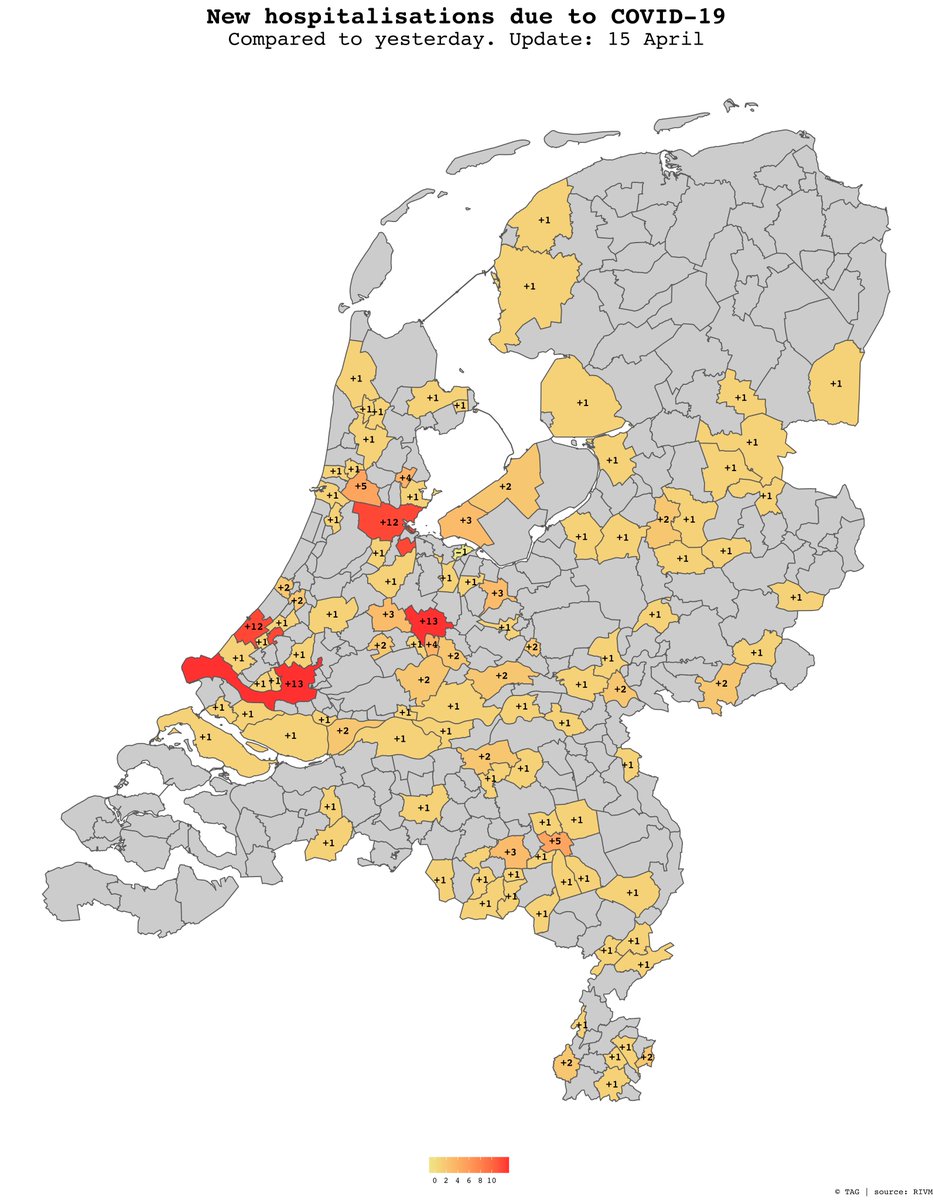
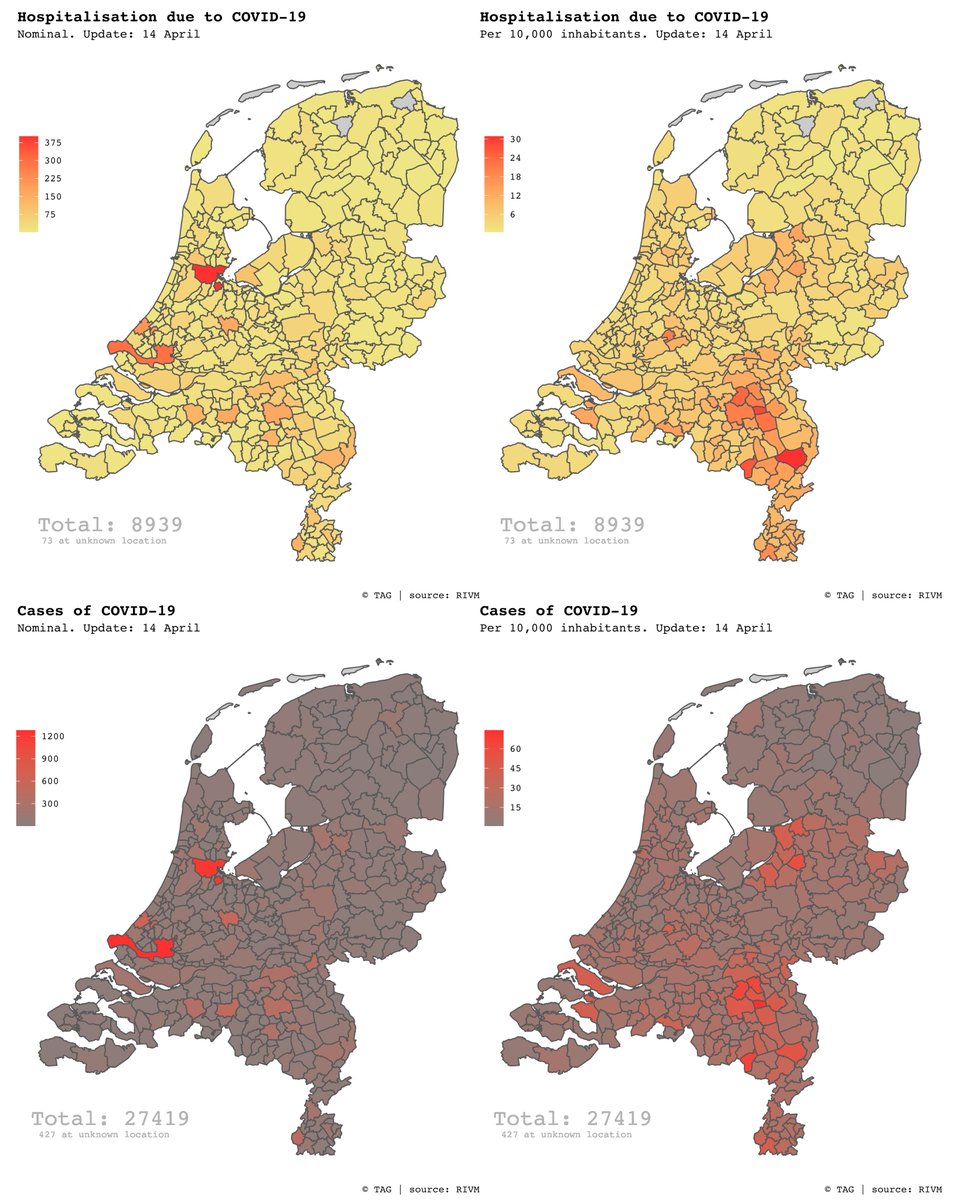
Map shows cases and hospitalisations per Dutch municipality.
#coronakaart #coronavirusNL #COVID19NL
#coronakaart #coronavirusNL #coronavirusNederland
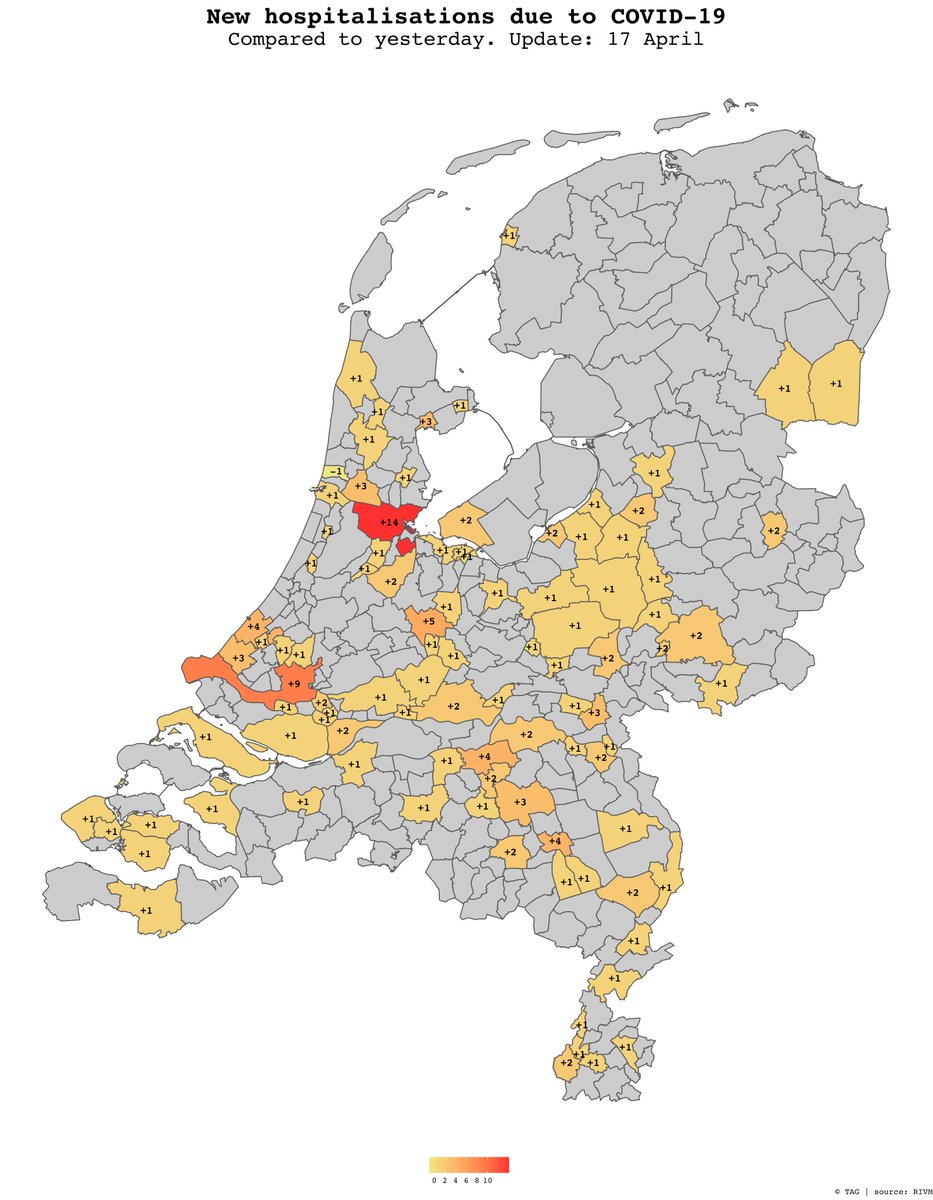
Biggest increase in Amsterdam (+26) and
Rotterdam (+8) and Utrecht (+7).
#coronakaart #coronavirusNL
Biggest increase in Amsterdam, Rotterdam (both +51) and 's-Gravenhage (+42).
#coronakaart #coronavirusNL #CoronaCrisis
Most hospitalisations per 10,000 inhabitants: Peel en Maas, Boekel, Cranendonck, Bernheze, Oudewater and Gemert-Bakel.
#coronavirusNL #COVID19NL

Graph shows the fatalities due to #COVIDー19 in the last two weeks per different age group.
#coronavirusNL #COVID19NL
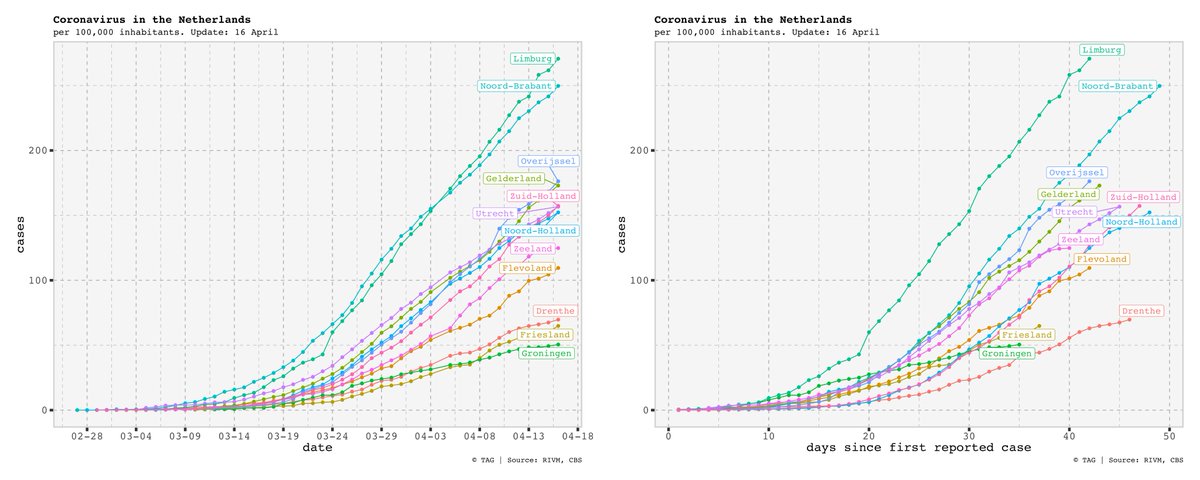
Left graph shows the development over time, whereas the right graph shows the development starting from the day of the first reported case.
#coronavirusNL #coronaNederland
