Update 17 April (thread)
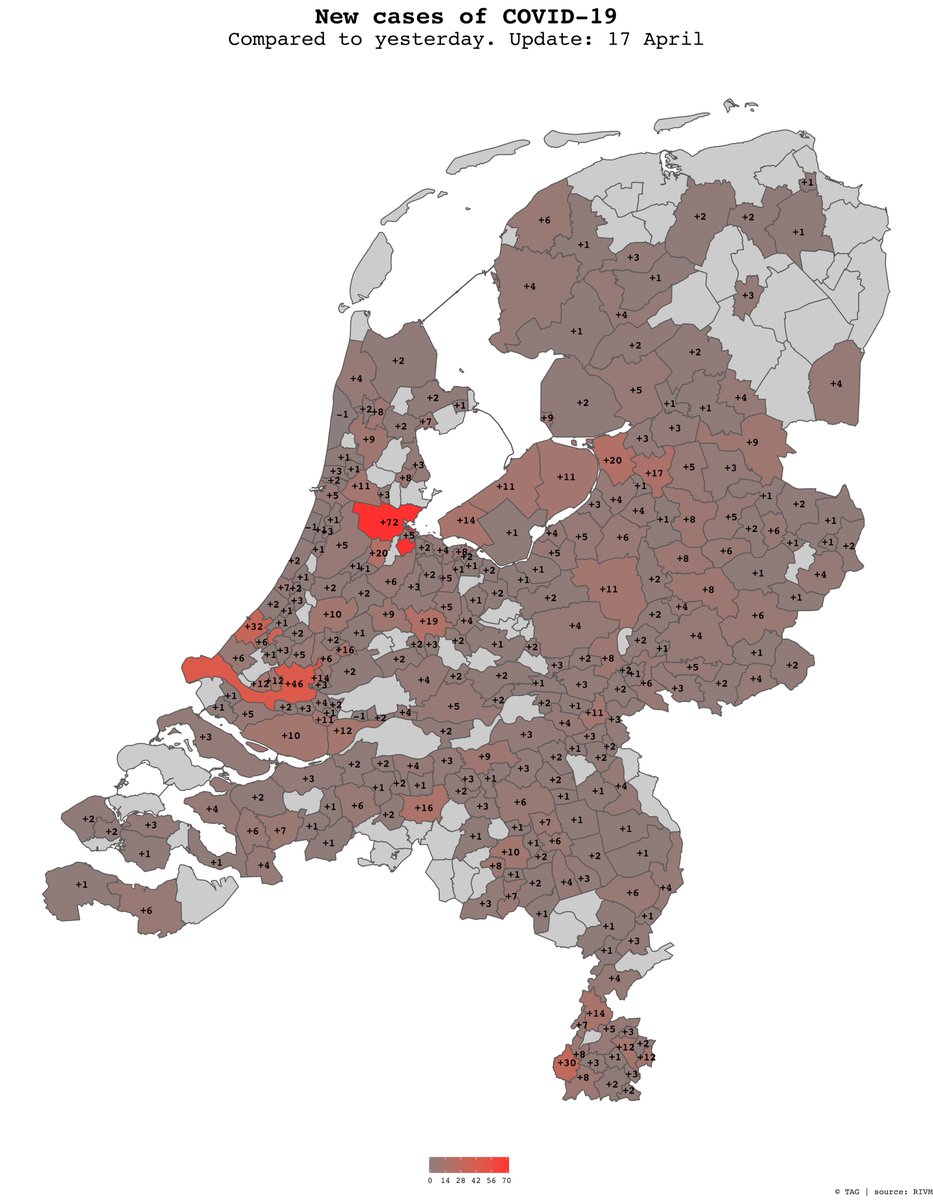
1235 new confirmed cases (total: 30.449)
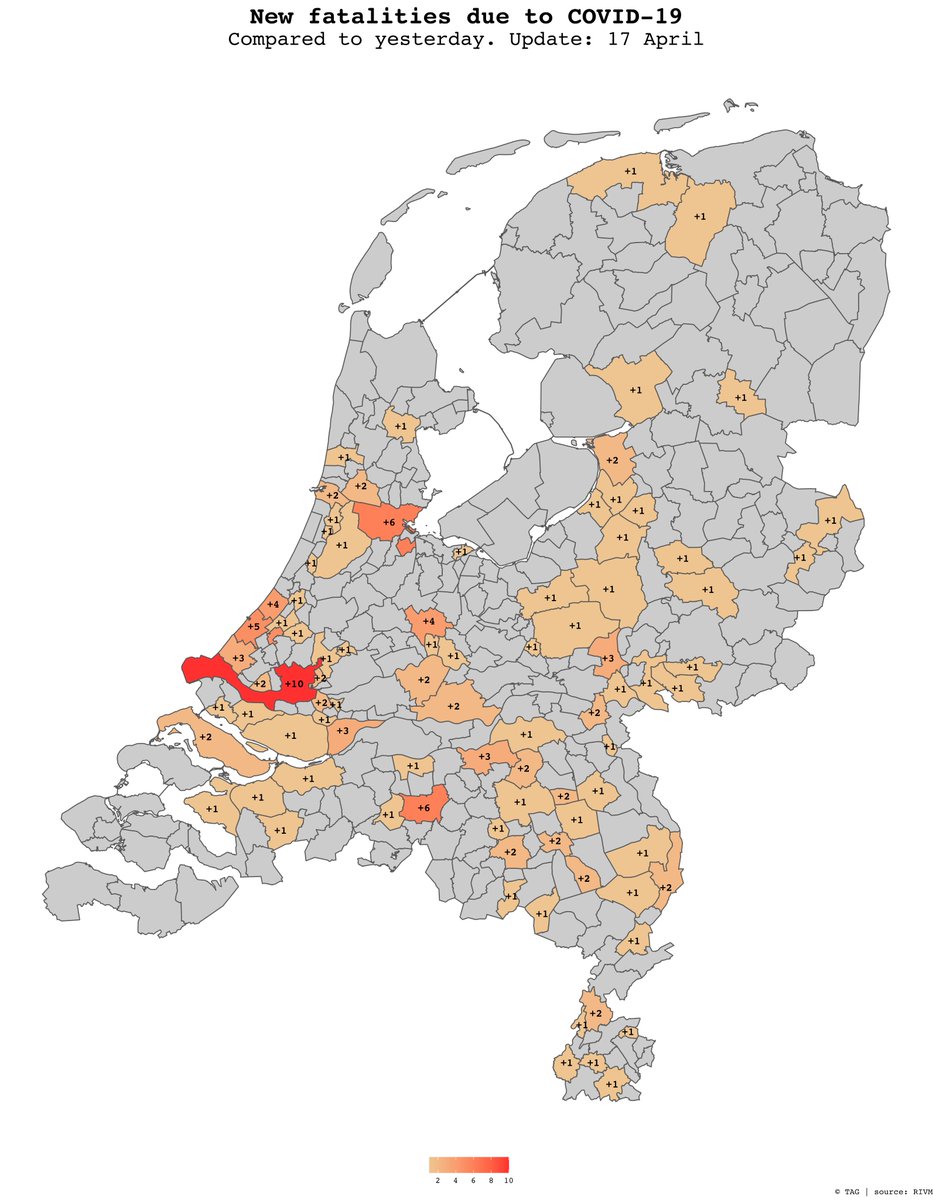
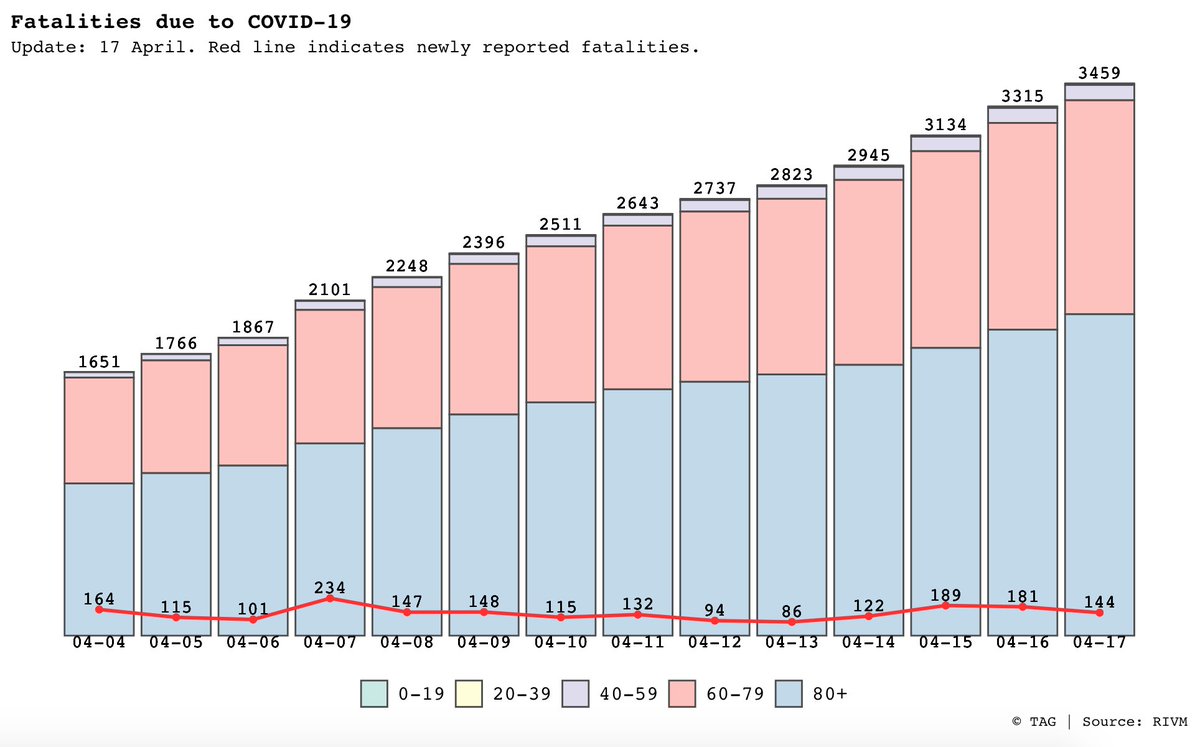
144 new fatalities (total: 3.459)
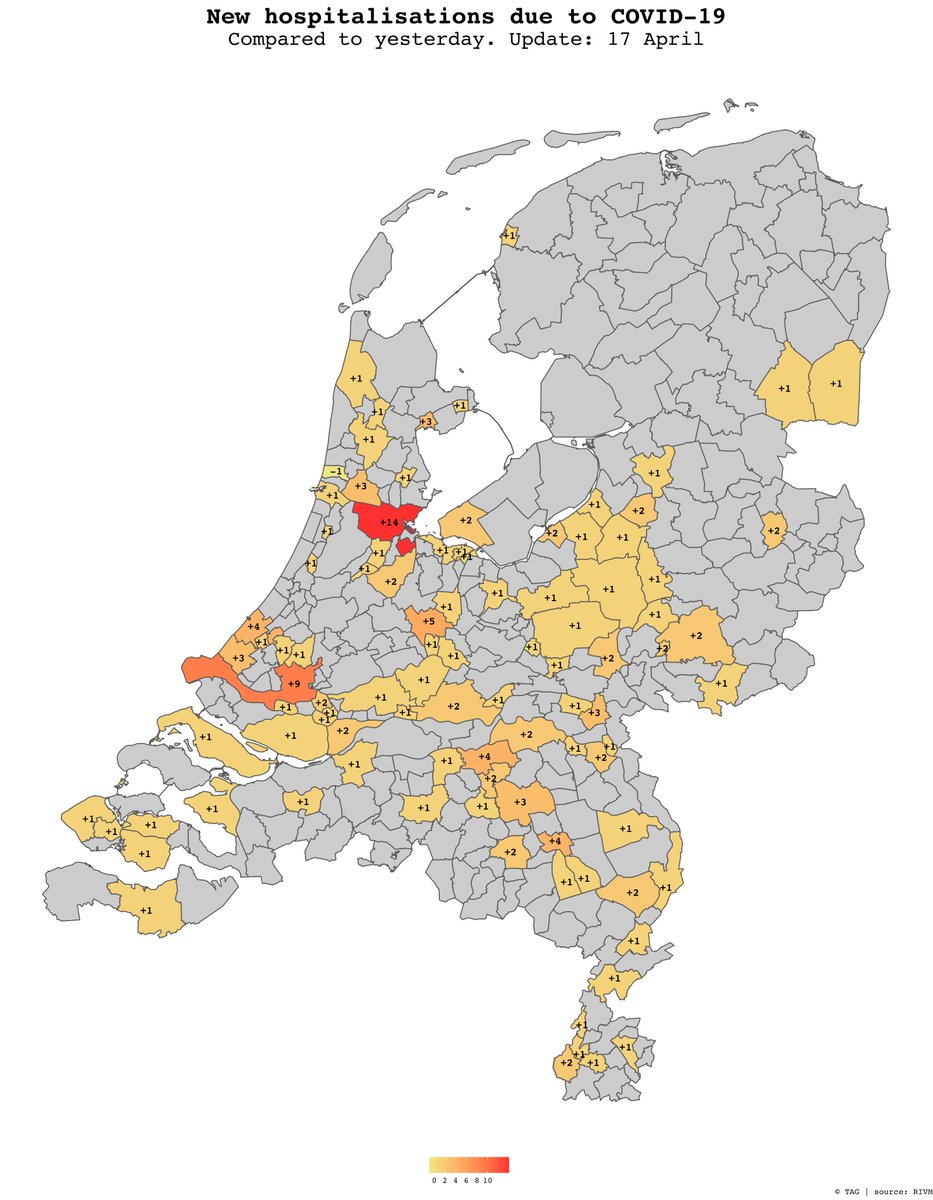
156 new hospitalisations (total: 9.465)
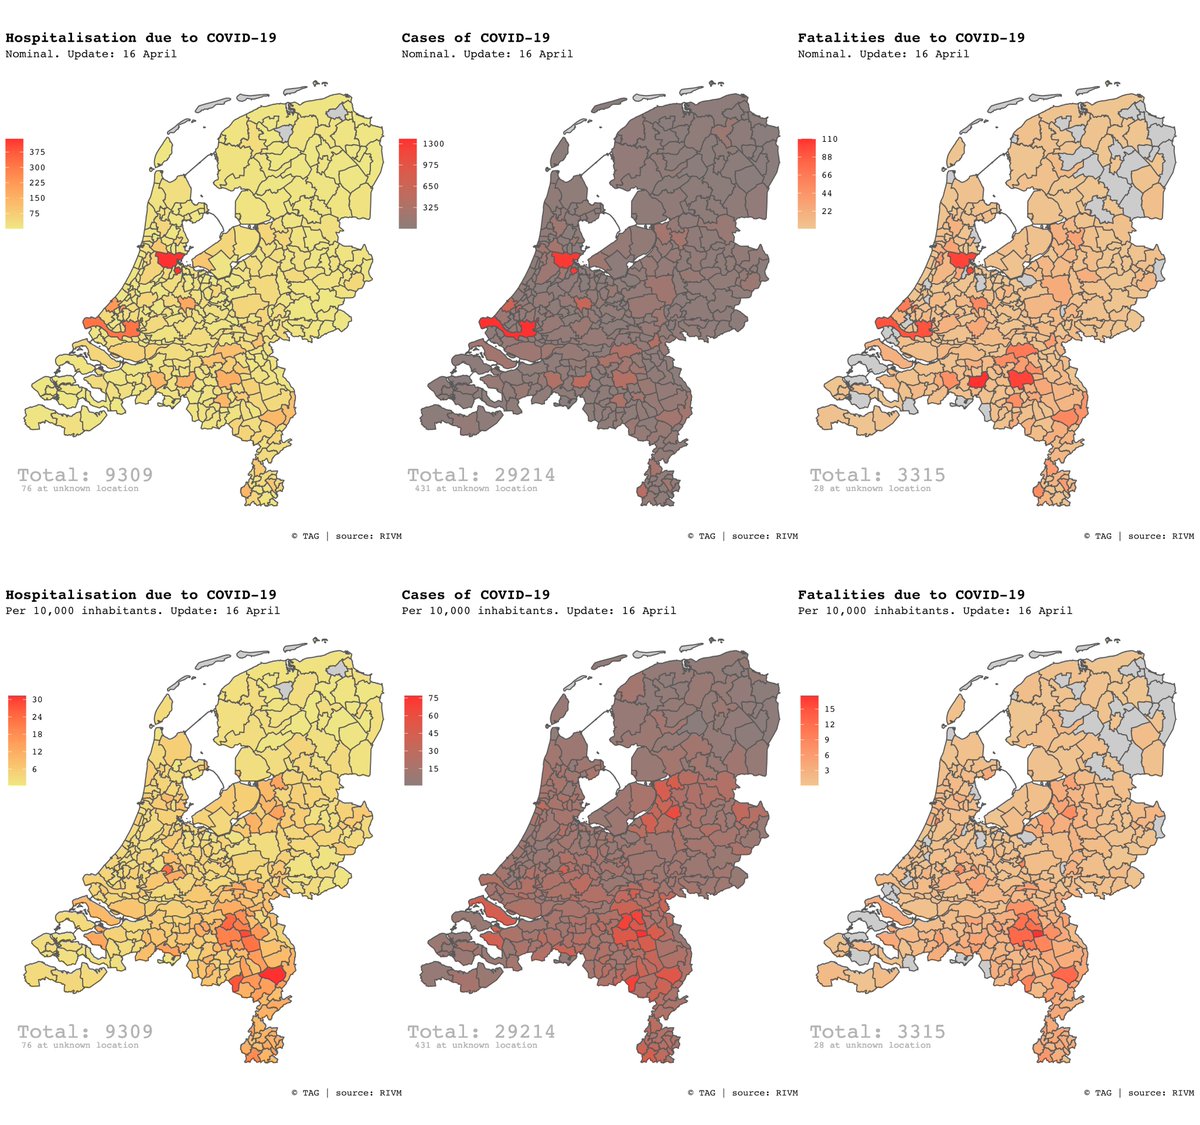
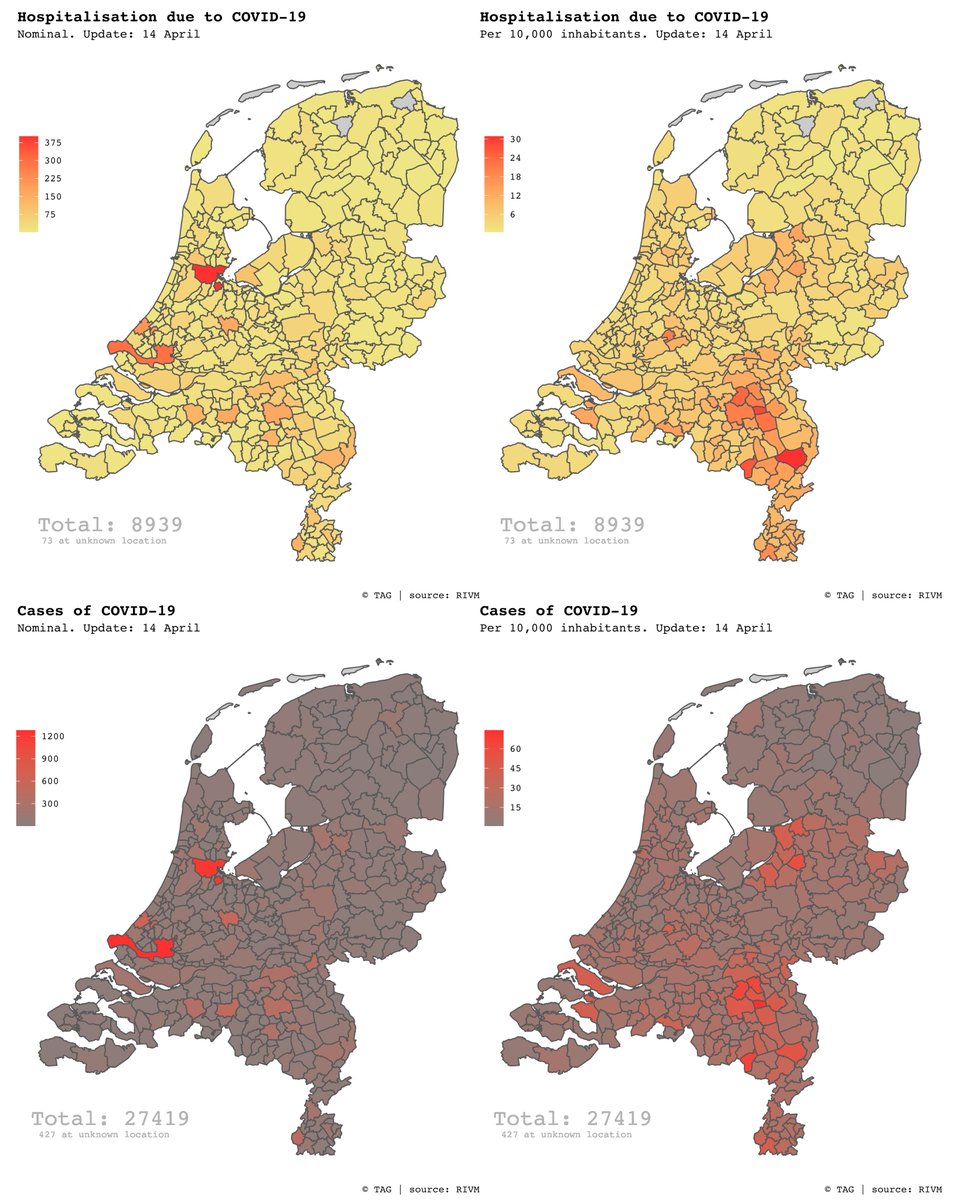
Map shows cases and hospitalisations per Dutch municipality.
#coronakaart #coronavirusNL #COVID19NL
1235 new confirmed cases (total: 30.449)
144 new fatalities (total: 3.459)
156 new hospitalisations (total: 9.465)
Map shows cases and hospitalisations per Dutch municipality.
#coronakaart #coronavirusNL #COVID19NL

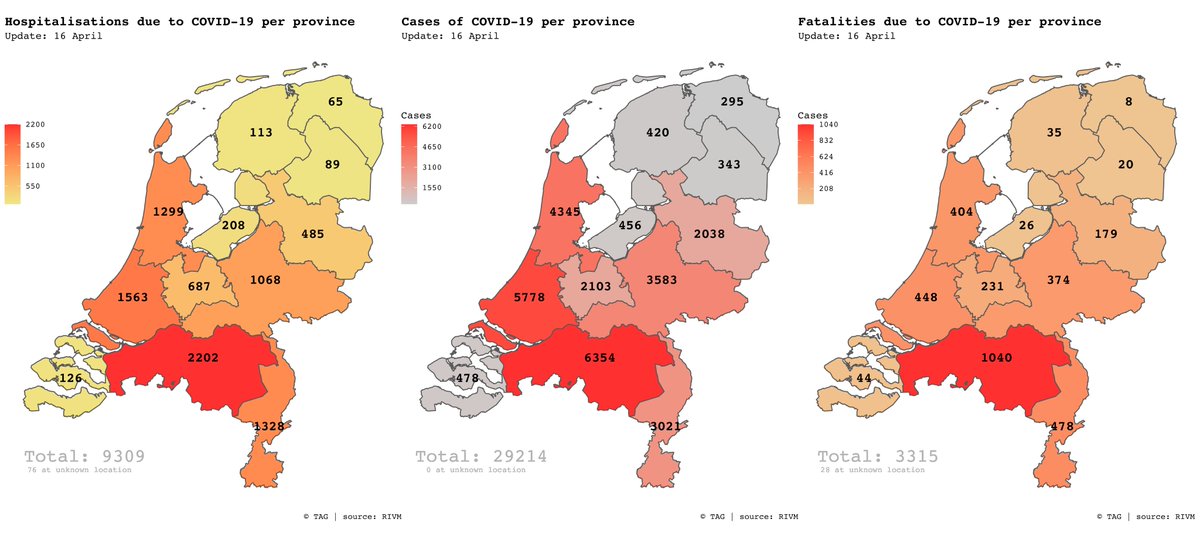
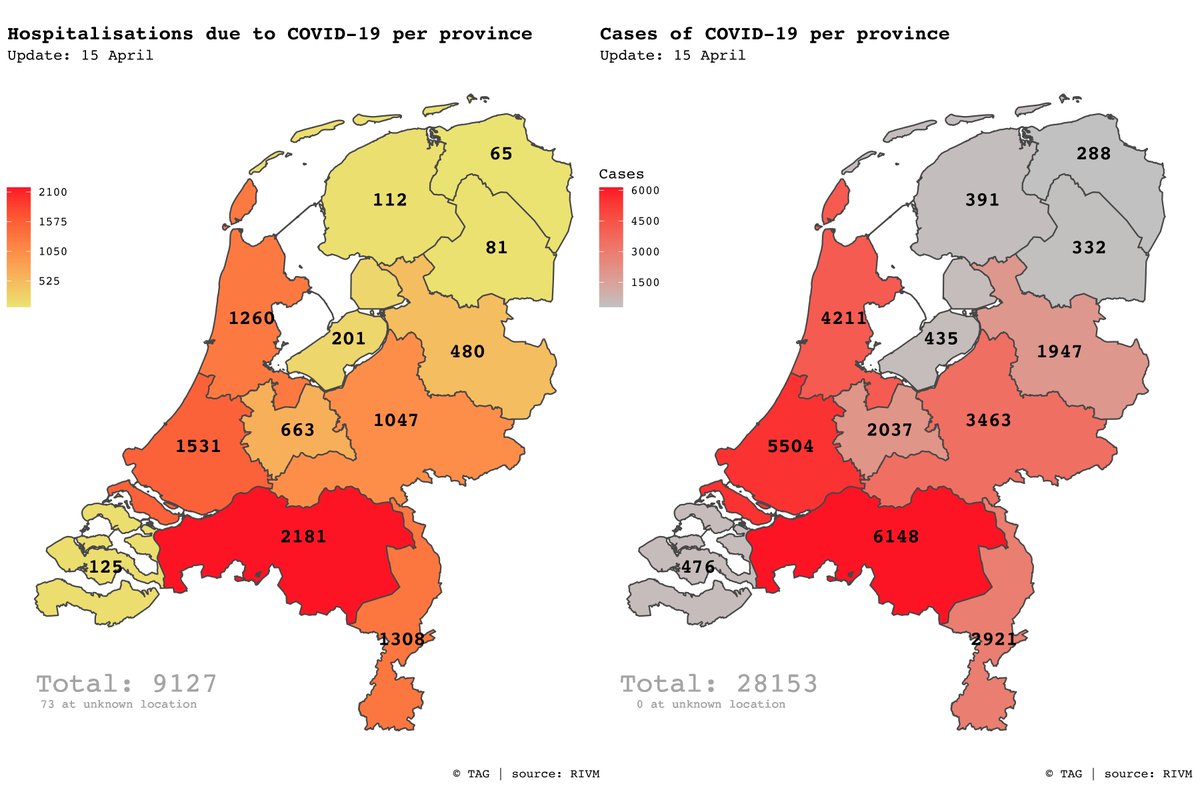
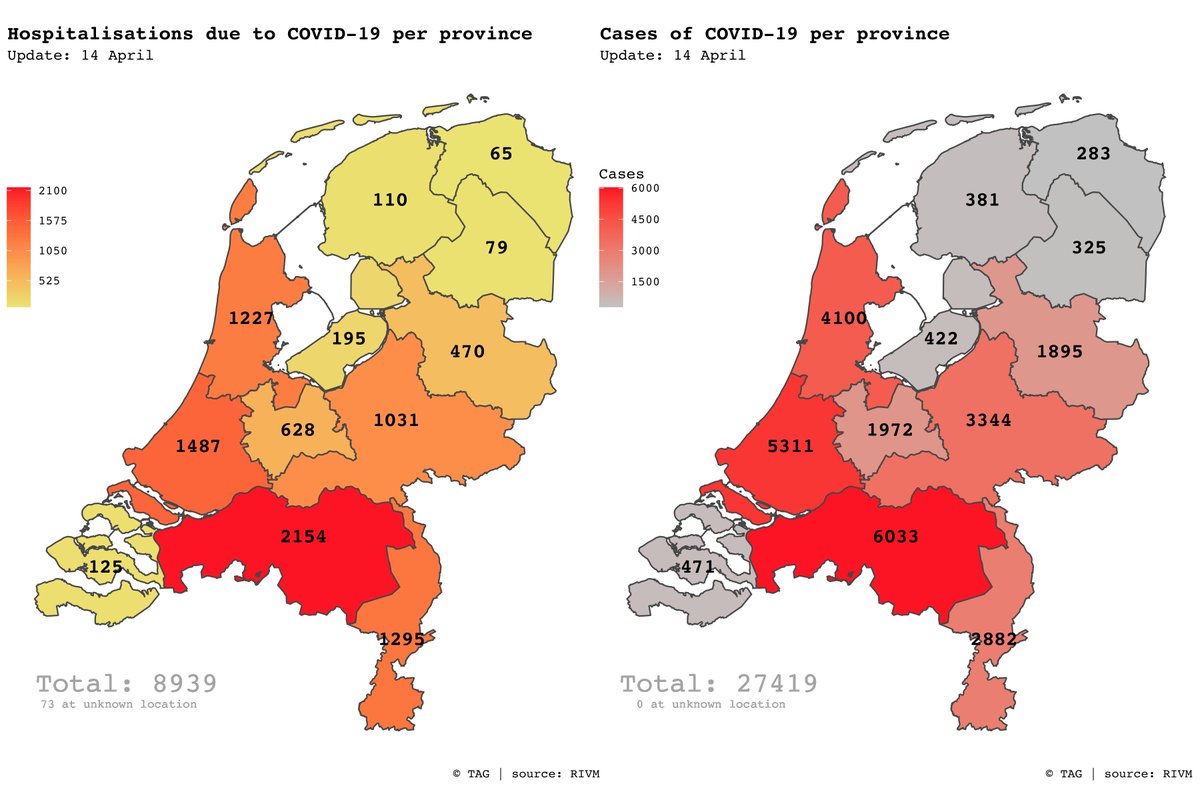
Total number of hospitalisations, cases and fatalities due to #COVID19 per Dutch province:
#coronakaart #coronavirusNL #coronavirusNederland
#coronakaart #coronavirusNL #coronavirusNederland

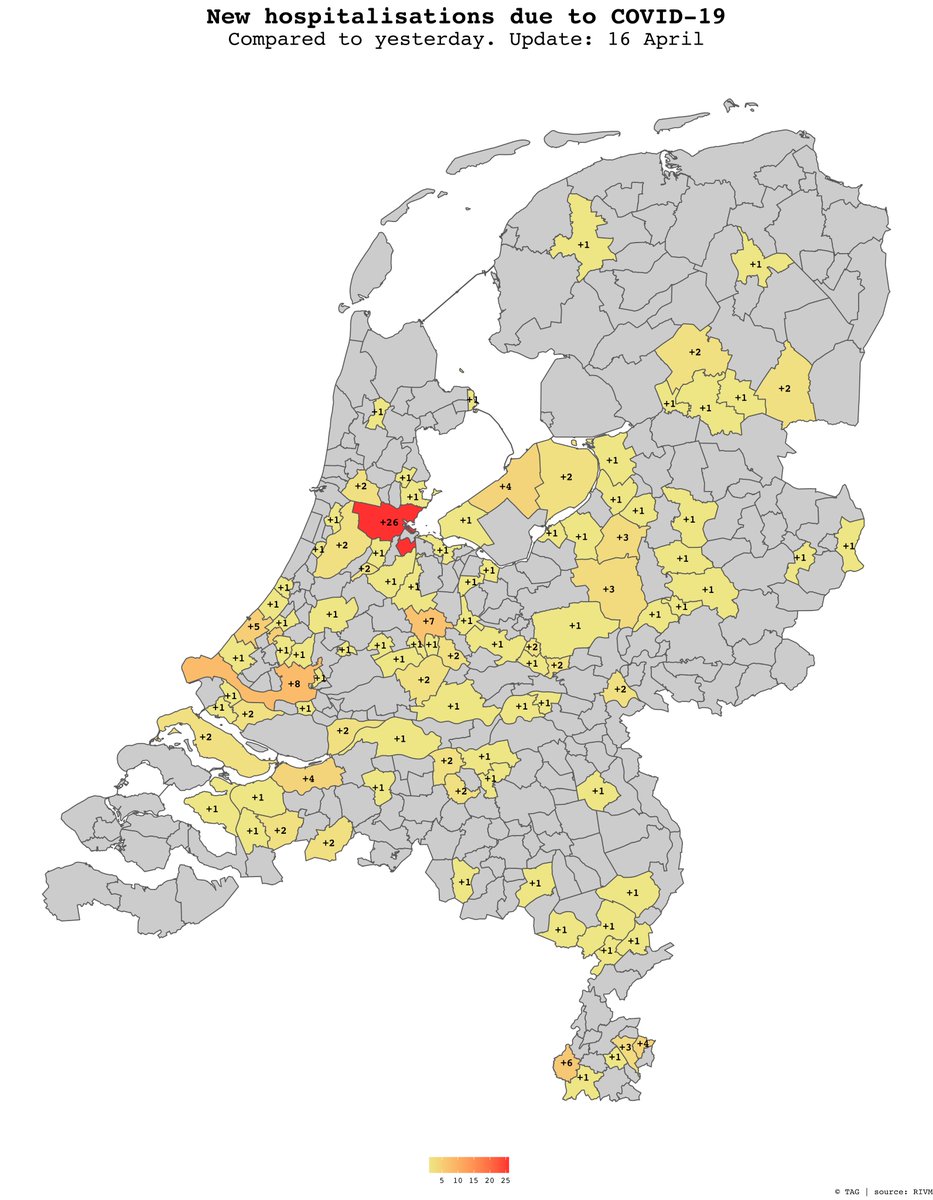
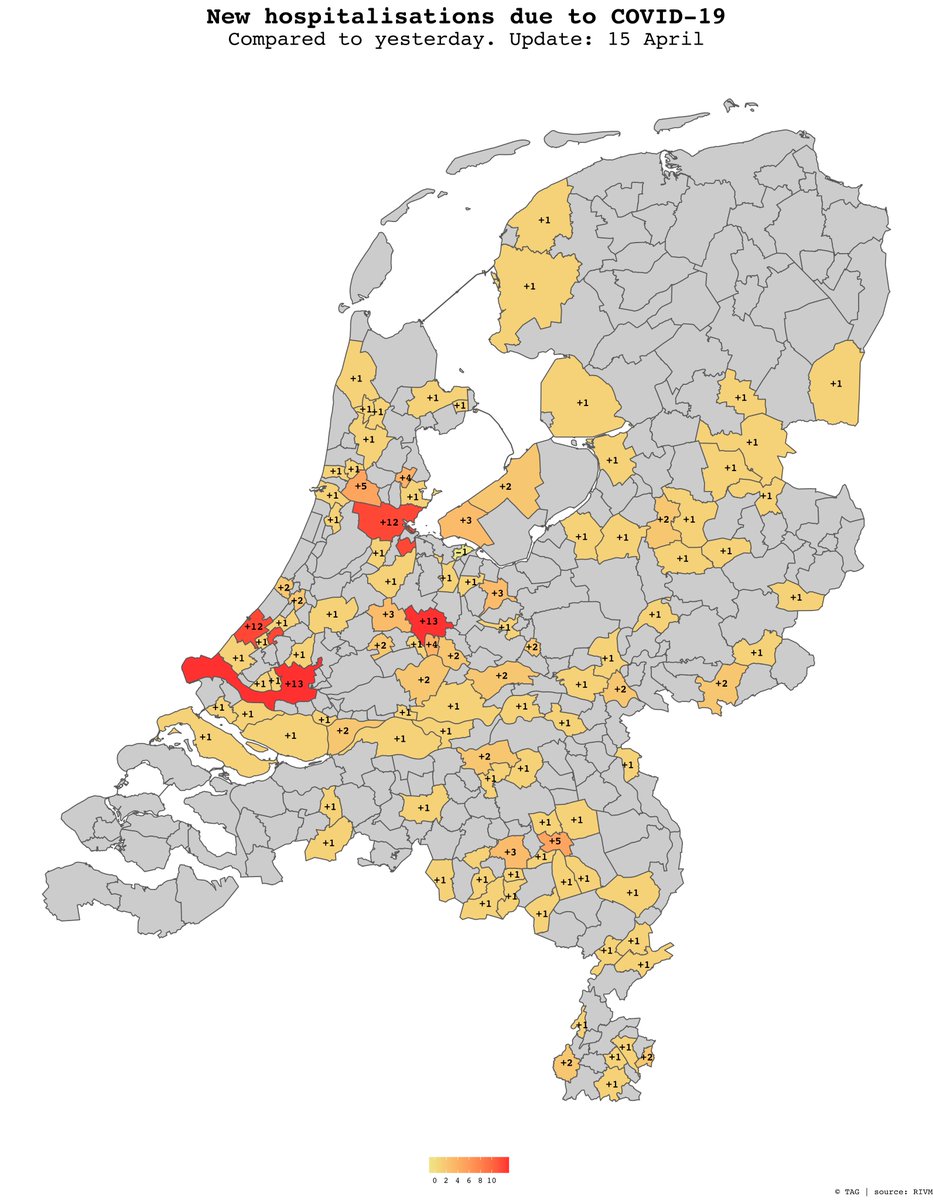
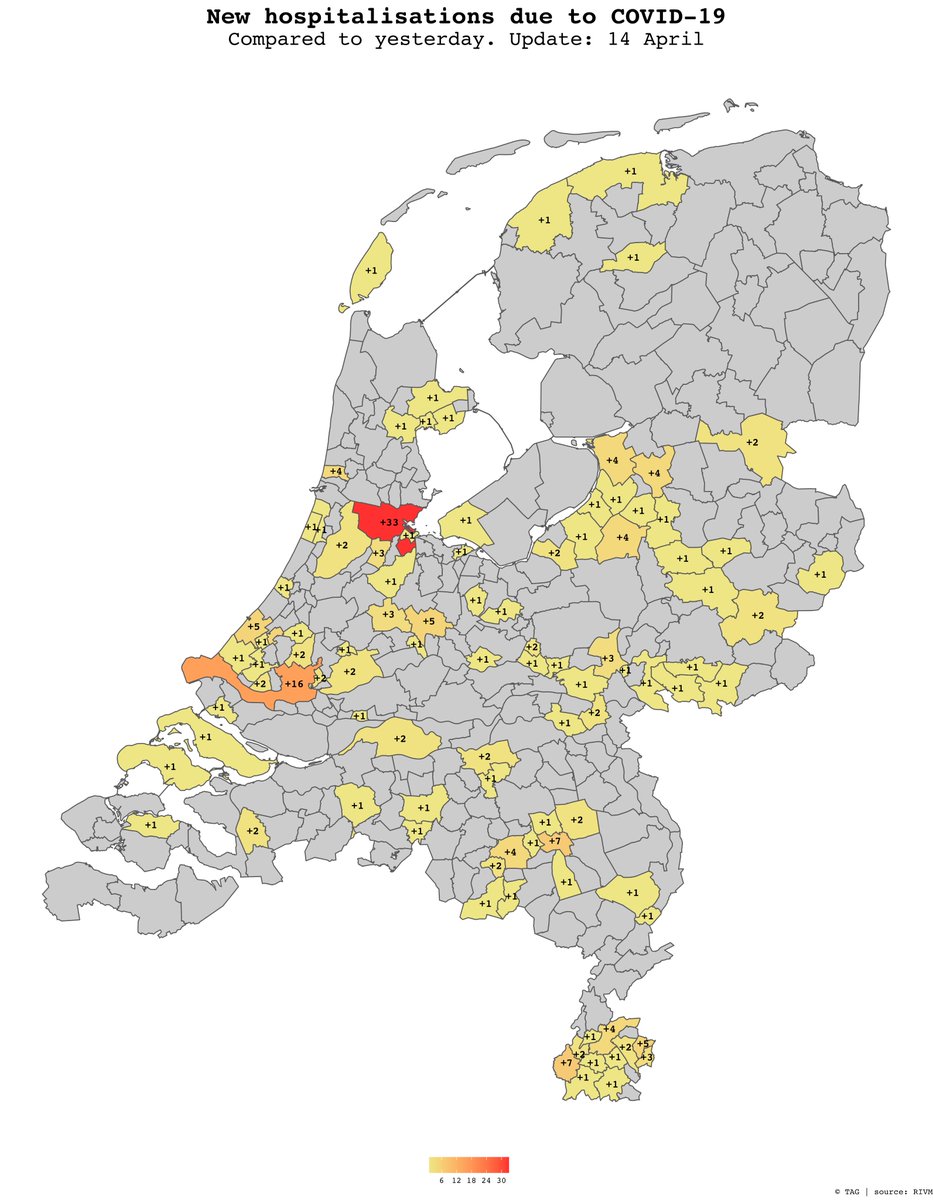
96 municipalities reports at least one new hospitalisation due to #COVID19, compared to yesterday.
Biggest increase in Amsterdam (+14), Rotterdam (+9) and Utrecht (+5).
#coronakaart #coronavirusNL
Biggest increase in Amsterdam (+14), Rotterdam (+9) and Utrecht (+5).
#coronakaart #coronavirusNL
272 municipalities report at least one new cases of #COVID19, compared to yesterday.
Biggest increase in Amsterdam (+72), Rotterdam (+46) and 's-Gravenhage (+32).
#coronakaart #coronavirusNL #CoronaCrisis
Biggest increase in Amsterdam (+72), Rotterdam (+46) and 's-Gravenhage (+32).
#coronakaart #coronavirusNL #CoronaCrisis
88 municipalities report at least one new fatality due to #COVID19, compared to yesterday.
Biggest increase in Rotterdam (+10), Amsterdam and Tilburg (both +6).
#coronakaart #coronavirusNL #CoronaCrisis
Biggest increase in Rotterdam (+10), Amsterdam and Tilburg (both +6).
#coronakaart #coronavirusNL #CoronaCrisis
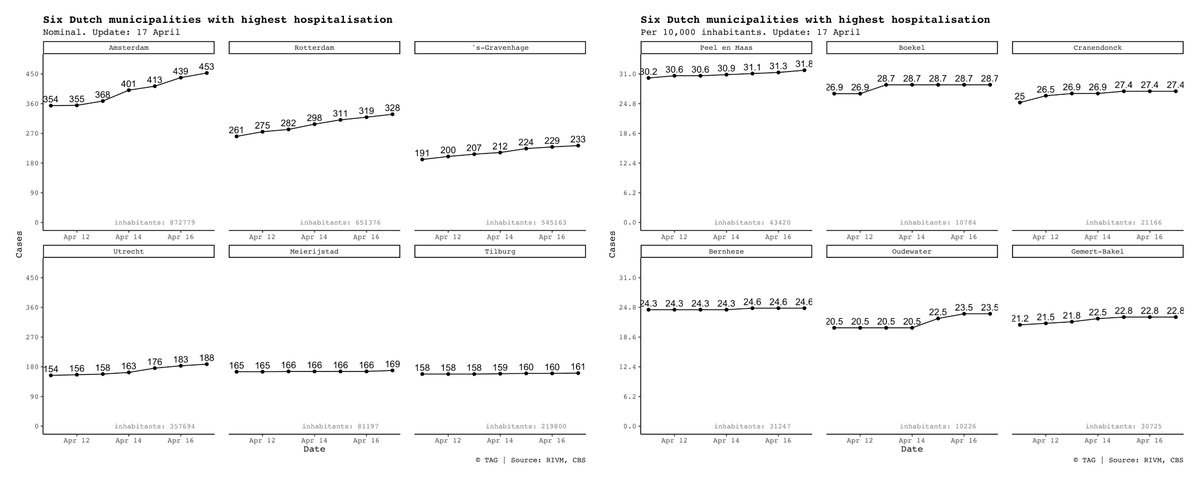
Most hospitalisations: Amsterdam, Rotterdam, 's-Gravenhage, Utrecht, Meierijstad and Tilburg.
Most hospitalisations per 10,000 inhabitants: Peel en Maas, Boekel, Cranendonck, Bernheze, Oudewater and Gemert-Bakel.
#coronavirusNL #COVID19NL
Most hospitalisations per 10,000 inhabitants: Peel en Maas, Boekel, Cranendonck, Bernheze, Oudewater and Gemert-Bakel.
#coronavirusNL #COVID19NL
Unfortunately, 144 new fatalities are reported. There might be some delay in these reports. The youngest deceased is between 25 and 29.
Graph shows the fatalities due to #COVIDー19 in the last two weeks per different age group.
#coronavirusNL #COVID19NL
Graph shows the fatalities due to #COVIDー19 in the last two weeks per different age group.
#coronavirusNL #COVID19NL
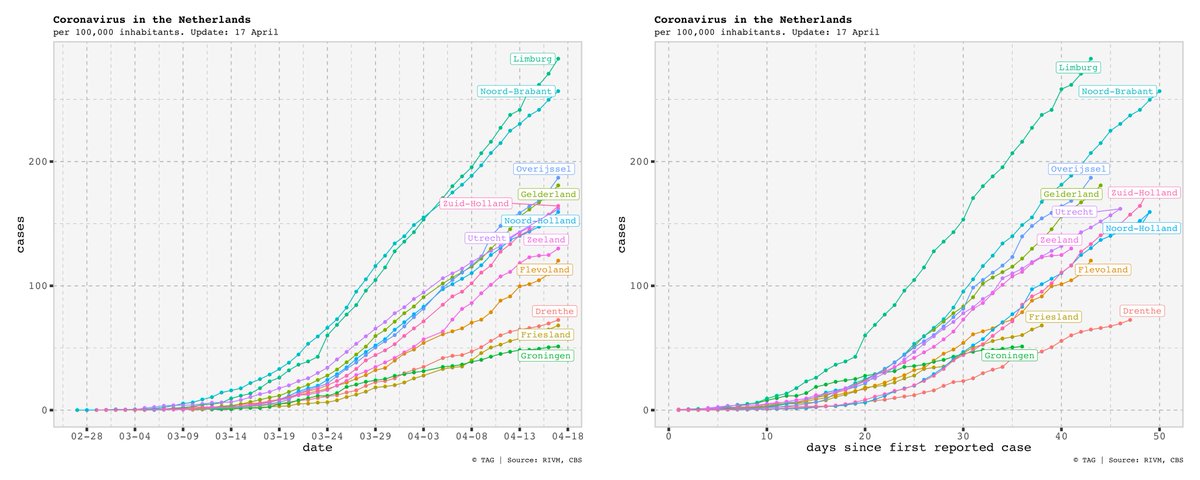
Cases of #COVID2019 per Dutch province per 100,000 inhabitants.
Left graph shows the development over time, whereas the right graph shows the development starting from the day of the first reported case.
#coronavirusNL #coronaNederland
Left graph shows the development over time, whereas the right graph shows the development starting from the day of the first reported case.
#coronavirusNL #coronaNederland
unroll @threadreaderapp