1/ Is the #COVID19 outbreak in the US going down?
Are we ready to lift lockdown?
How would an epidemiologist look at the data to help us understand these questions?
Let me take you through the @CDCgov COVIDView data released today, w some commentary.
cdc.gov/coronavirus/20…
Are we ready to lift lockdown?
How would an epidemiologist look at the data to help us understand these questions?
Let me take you through the @CDCgov COVIDView data released today, w some commentary.
cdc.gov/coronavirus/20…
2/ First off, I am so glad the CDC is releasing these national summary reports. For the longest time, I had to listen to CSPAN coronavirus briefings at 1.5x speed to try to glean any new information.
Public Health Surveillance is what the CDC does. Glad they are in the game
Public Health Surveillance is what the CDC does. Glad they are in the game
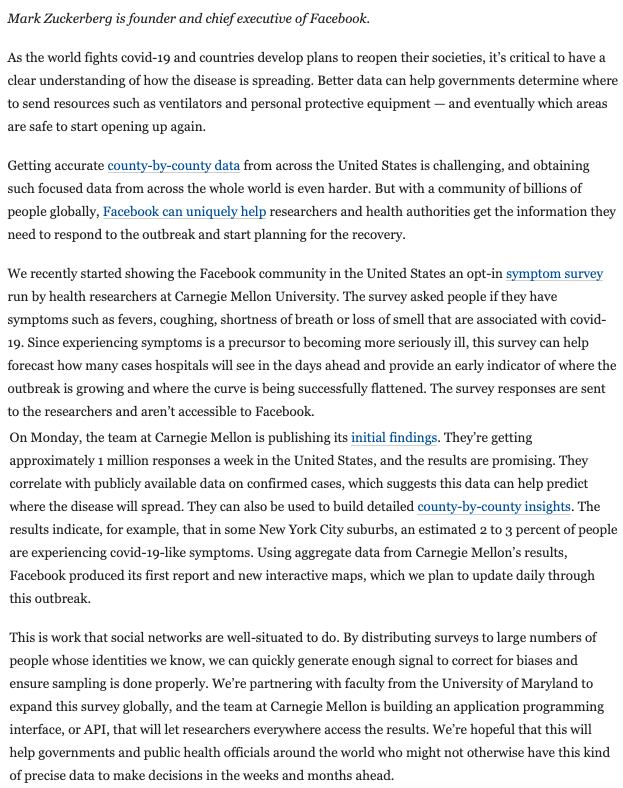
3/ OK- first things first.
How many cases were diagnosed this week? Is that number up or down?
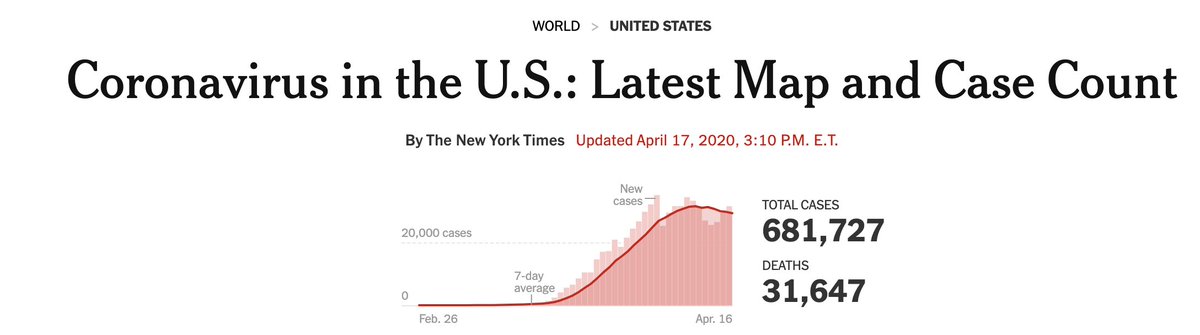
I actually prefer the NYT website for this one
New Cases Are DOwN! ViCTory!
(not so fast)
two things:
First, what's the date of onset?
Second, what's the testing rate?
How many cases were diagnosed this week? Is that number up or down?
I actually prefer the NYT website for this one
New Cases Are DOwN! ViCTory!
(not so fast)
two things:
First, what's the date of onset?
Second, what's the testing rate?
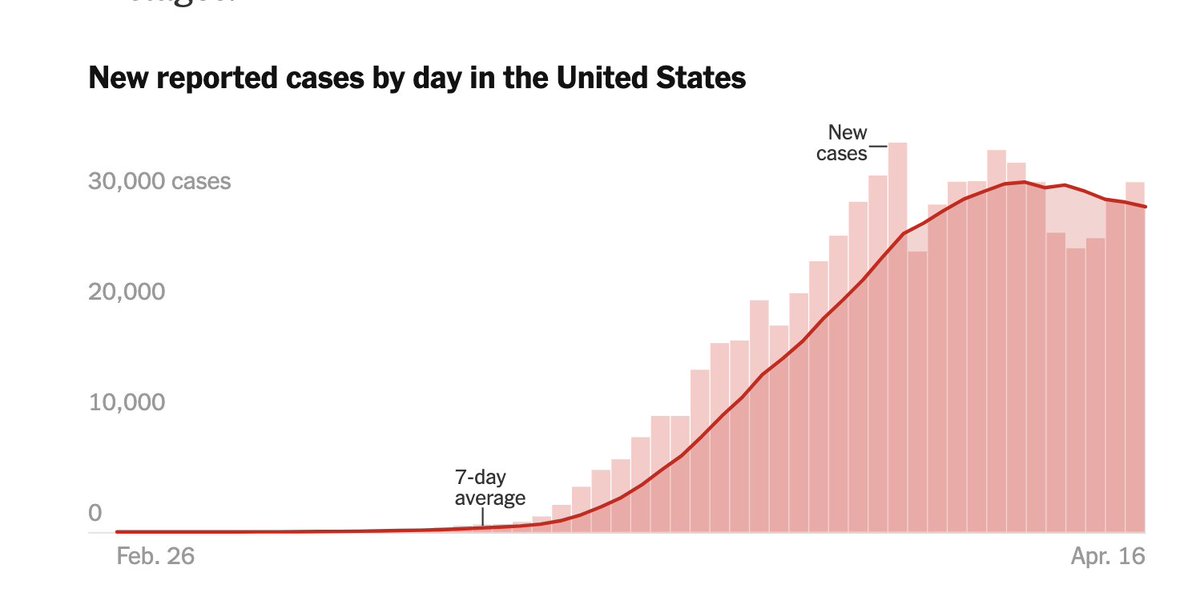
4/ When you draw an epidemic curve like this one, you don't want to look at report date, because that's heavily influenced by testing/reporting lag
Say you cleared a backlog of old samples last week, diagnosed a lot of old cases, it would look like a bump and then a decline
Say you cleared a backlog of old samples last week, diagnosed a lot of old cases, it would look like a bump and then a decline
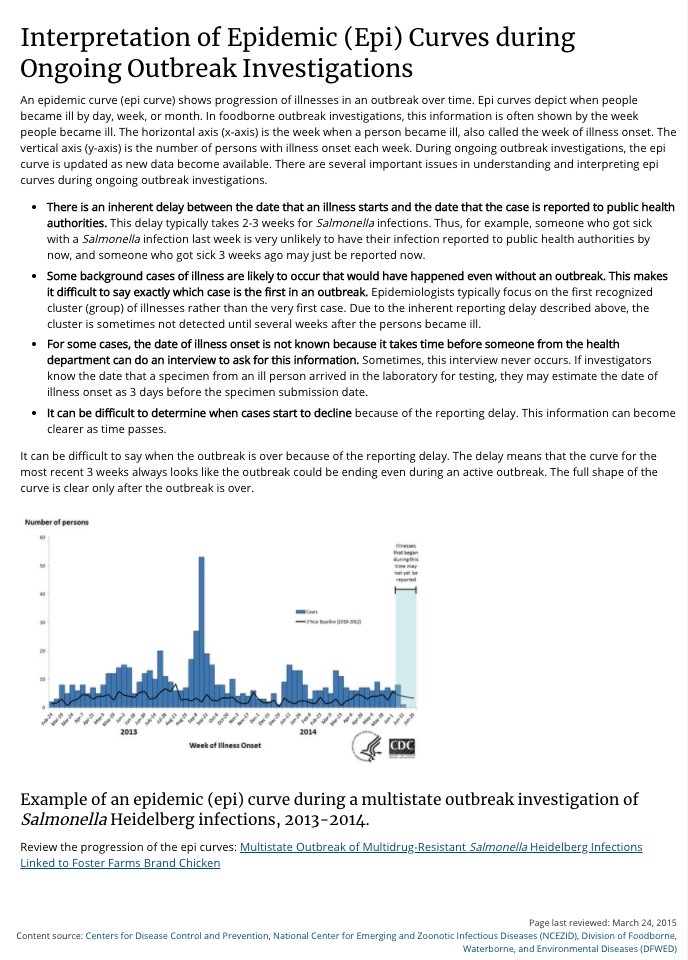
5/ Unfortunately, public health can't draw this curve right, because the volume of positive cases has overwhelmed the ability to interview cases, and find out their date of symptom onset
Ideally, this would be collected when a specimen is collected!
Ideally, this would be collected when a specimen is collected!
6/ The other way to see what's actually happening with the outbreak without it being totally influenced by the volume of testing is to look at the test positivity rate
Zeke brought in the baseball analogy here. Was that slightly condescending or helpful?
statnews.com/2020/03/24/we-…
Zeke brought in the baseball analogy here. Was that slightly condescending or helpful?
statnews.com/2020/03/24/we-…
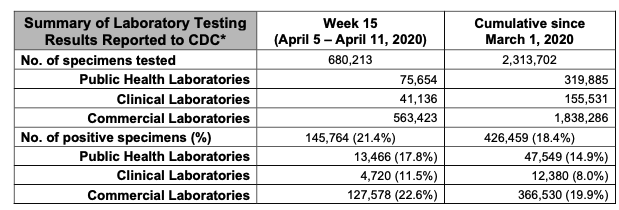
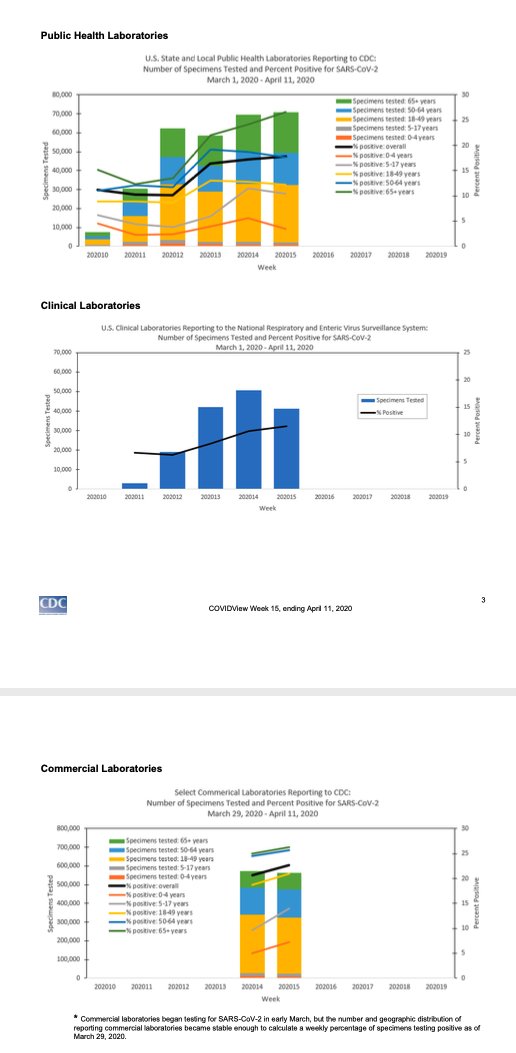
7/ Well, back to COVIDView
There was a fair amount of testing last week, but the nationwide rate of tests being positive rate was up, not down.
22% of all tests done in commercial labs were positive. That is high. We are probably still only testing people at high risk
There was a fair amount of testing last week, but the nationwide rate of tests being positive rate was up, not down.
22% of all tests done in commercial labs were positive. That is high. We are probably still only testing people at high risk
8/ Here's the map of positive rates by state
NY, NJ > 40% (my gosh)
MI, CT > 30%
GA, MA, IL, CO > 20%
PA, DC, MD, IN, LA, DE, VA > 15%
RI, SD, AL, NV, SC, IA, CA, PR, TX, MO, FL, KA > 10%
None of these states should be reopening til + rate is 5% or less
covidmap.aledade.com
NY, NJ > 40% (my gosh)
MI, CT > 30%
GA, MA, IL, CO > 20%
PA, DC, MD, IN, LA, DE, VA > 15%
RI, SD, AL, NV, SC, IA, CA, PR, TX, MO, FL, KA > 10%
None of these states should be reopening til + rate is 5% or less
covidmap.aledade.com
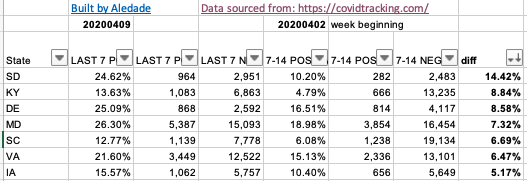
9/ You can also look at the change in positivity week by week in different states
Sharpest increases in + rate:
SD went from 10% -> 24% + samples
KY 5%-> 14%
DE 16% -> 25%
MD 19%->26%
SC 6%->13%
VA 15% -> 22%
@GovernorVA doesn't need protestors telling him to open up right now
Sharpest increases in + rate:
SD went from 10% -> 24% + samples
KY 5%-> 14%
DE 16% -> 25%
MD 19%->26%
SC 6%->13%
VA 15% -> 22%
@GovernorVA doesn't need protestors telling him to open up right now
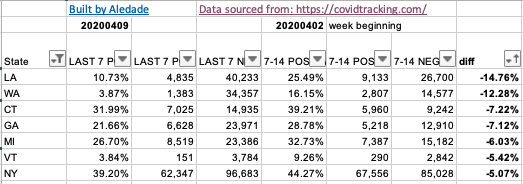
10/ Fortunately, there are also some states that have a declining positivity rate, giving promise to some hard-hit states that the outbreak may have crested (clinical correlation required!)
LA down 25% -> 11%
WA 16%->4% (great job WA State)
CT 39%->32%
GA 29%->22%
MI 33%->27%
LA down 25% -> 11%
WA 16%->4% (great job WA State)
CT 39%->32%
GA 29%->22%
MI 33%->27%
11/ So when we see these national trends, it's reflecting some areas where the outbreak seems to be coming off sky-high positivity levels, and others where it appears to be going up, in many smaller markets like South Dakota
But overall, positive rates are HIGH and trends are up
But overall, positive rates are HIGH and trends are up
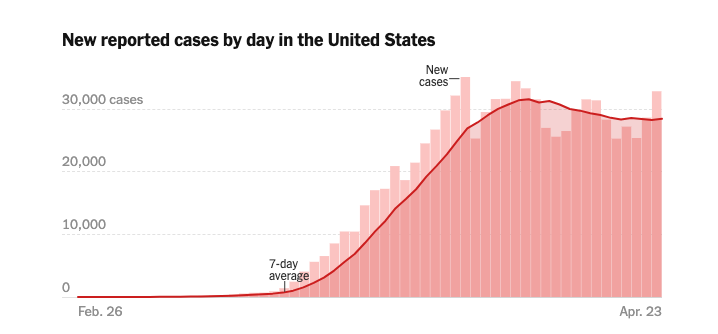
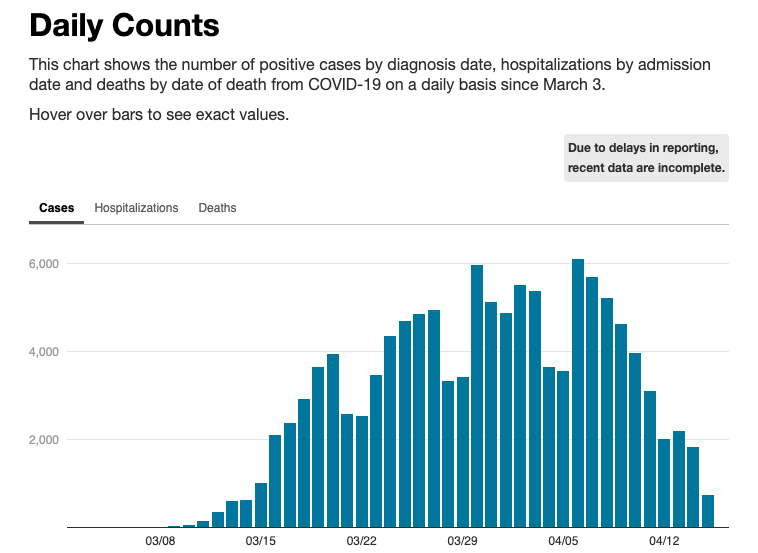
12/ But we have to look at all the data together to see what's going on, not just positivity rate - Trends in Cases, Hospitalizations, Deaths (remembering that there is a time lag between each stage)
Let's dive into NYC, because their epis are the best
www1.nyc.gov/site/doh/covid…
Let's dive into NYC, because their epis are the best
www1.nyc.gov/site/doh/covid…
13/ On March 28th, I looked at the syndromic surveillance data (more on that later), and prayerfully predicted that NYC infections may have slowed
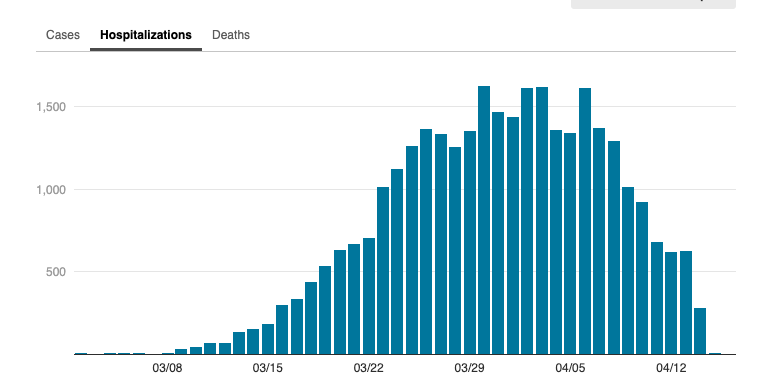
14/ And sure enough, that seemed to be about the peak of the epidemic, although I tell you, what looks clear in hindsight is hard to see when you're in the middle of it.
ED visits
then diagnosed cases
then hospitalizations
finally deaths
yes, NYC R<1 ❤️
ED visits
then diagnosed cases
then hospitalizations
finally deaths
yes, NYC R<1 ❤️
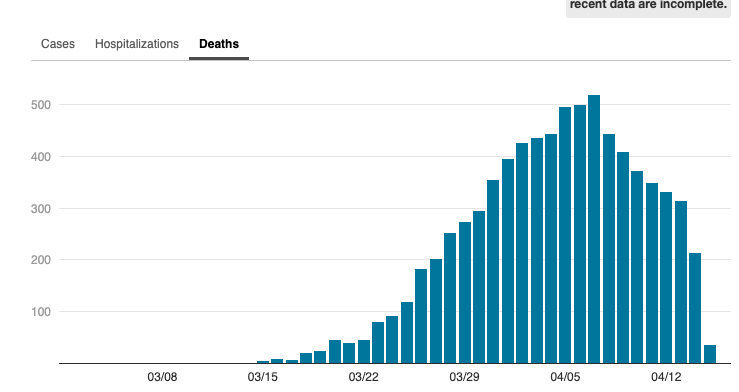
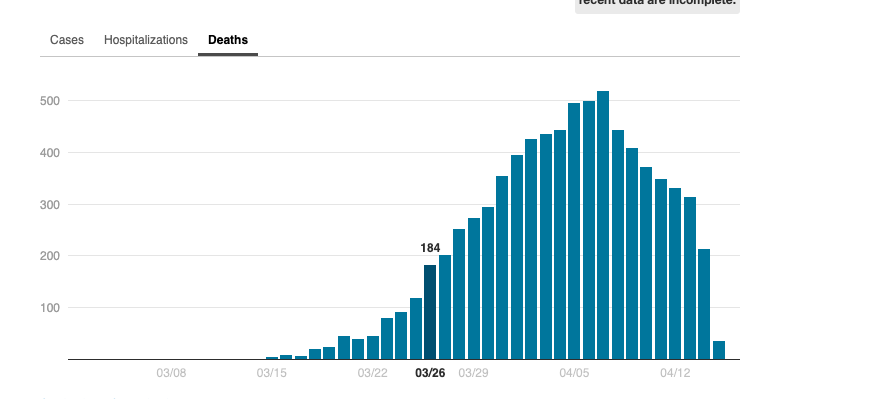
15/ But even if the tide turned on March 26, see how much suffering and death there was yet to come
These are the official COVID-related deaths after March 26, and sadly, thousands more to come.
And NYC has done a great service to the country by being open about other deaths..
These are the official COVID-related deaths after March 26, and sadly, thousands more to come.
And NYC has done a great service to the country by being open about other deaths..
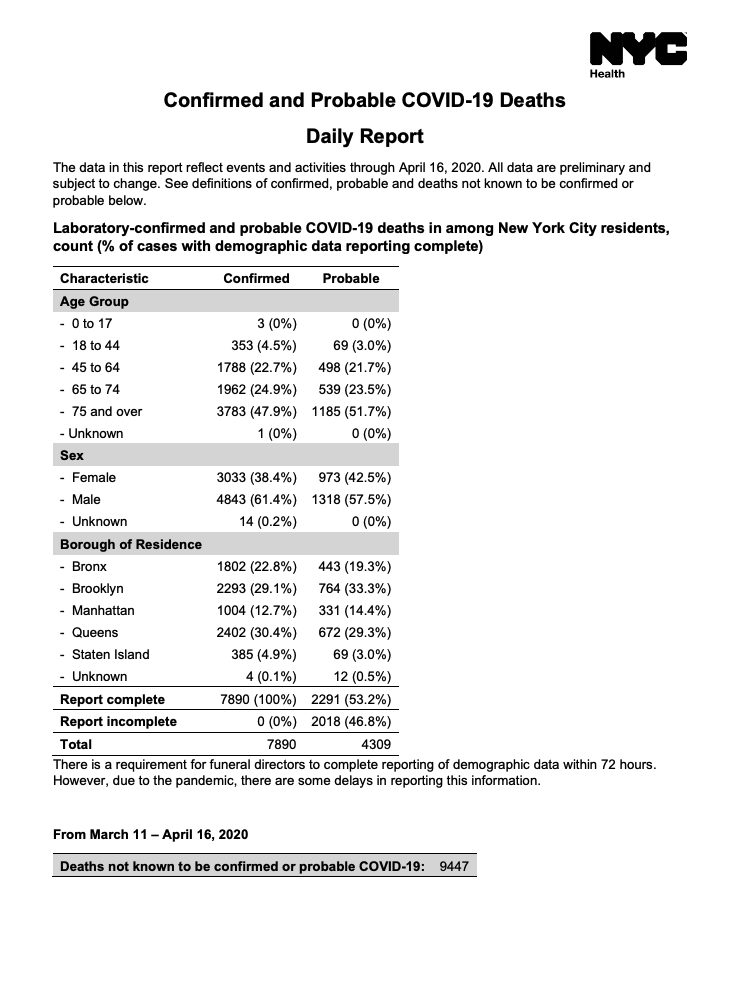
16/ These are incredible numbers.
In a little over a month, 7,890 deaths due to COVID, and another 4,309 probable cases...But also thousands of extra deaths NOT directly attributable to COVID.
There would normally be ~5400 deaths in NYC over this time frame. There were 9,447 😮
In a little over a month, 7,890 deaths due to COVID, and another 4,309 probable cases...But also thousands of extra deaths NOT directly attributable to COVID.
There would normally be ~5400 deaths in NYC over this time frame. There were 9,447 😮
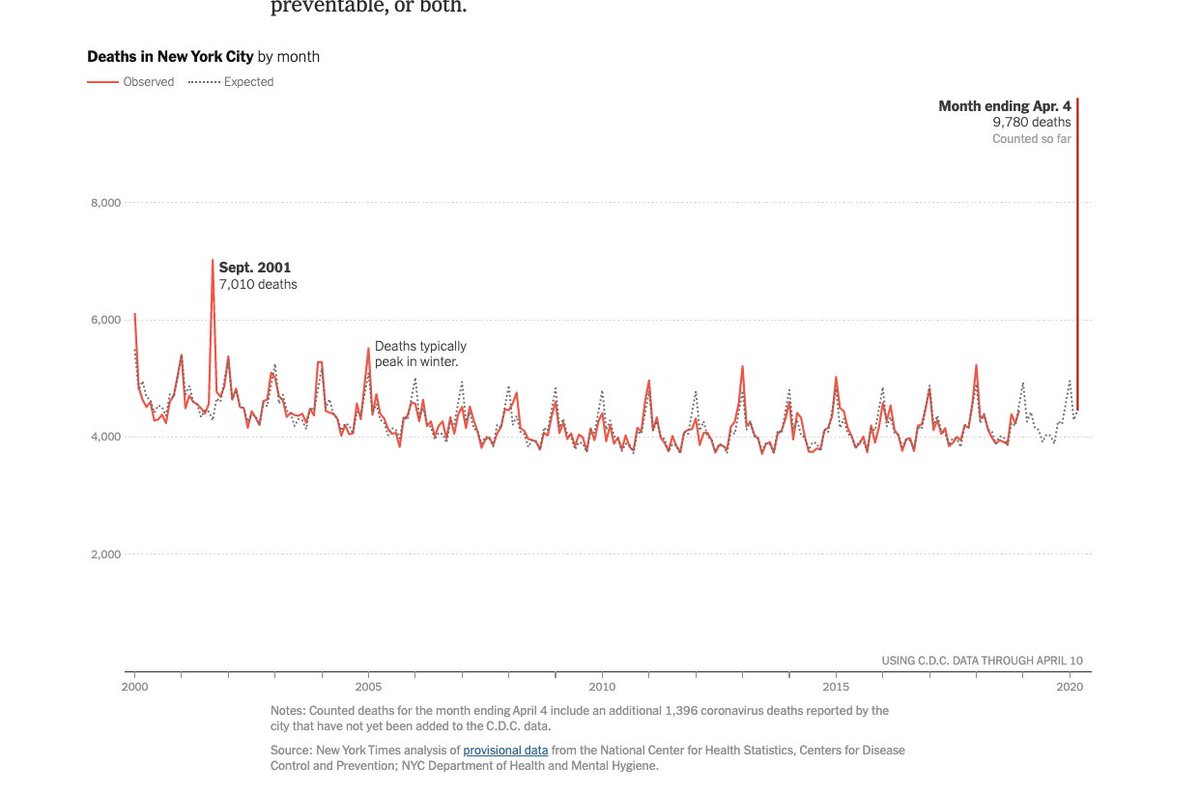
17/ THIS IS NOT LIKE ANNUAL FLU
The NYT graph made this point visually.
here's another stat- we have seen >15,000 excess deaths in NYC over the past 5 weeks.
Over three waves of the 1918 flu pandemic, there were 30,000 deaths in NYC.
THIS IS NOT FLU
ncbi.nlm.nih.gov/pmc/articles/P…
The NYT graph made this point visually.
here's another stat- we have seen >15,000 excess deaths in NYC over the past 5 weeks.
Over three waves of the 1918 flu pandemic, there were 30,000 deaths in NYC.
THIS IS NOT FLU
ncbi.nlm.nih.gov/pmc/articles/P…
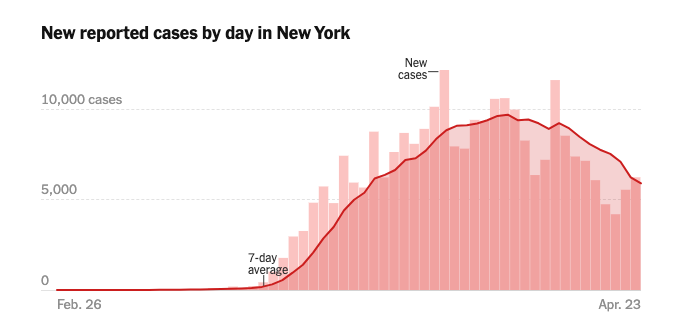
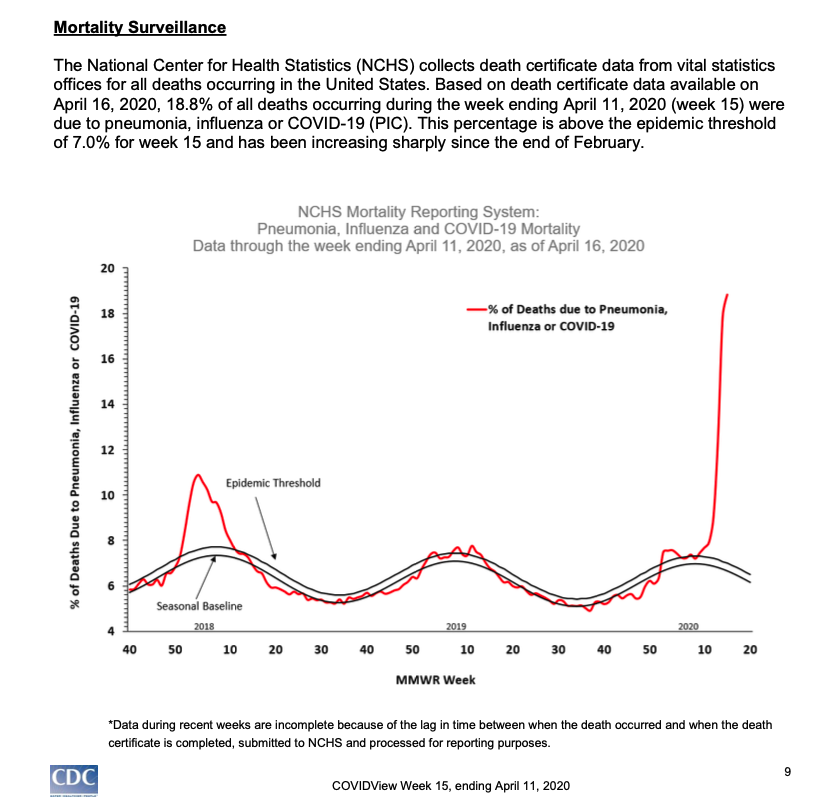
18/ So reopening is not a small decision. The rest of the country has not experienced NYC-level outbreak. But it could.
The spike in P&I deaths is not as astronomical as in NYC, but it's still rising.
Is the outbreak getting better?
The death data doesn't show it yet.
The spike in P&I deaths is not as astronomical as in NYC, but it's still rising.
Is the outbreak getting better?
The death data doesn't show it yet.
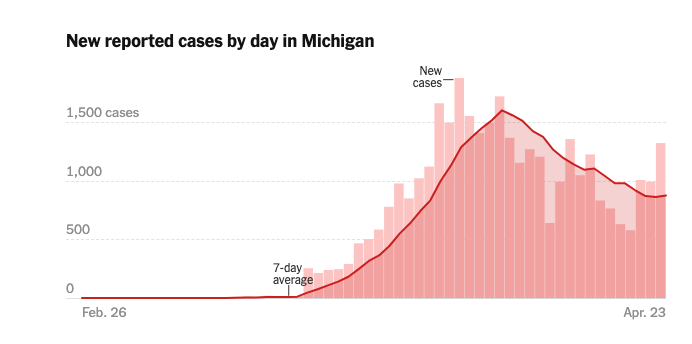
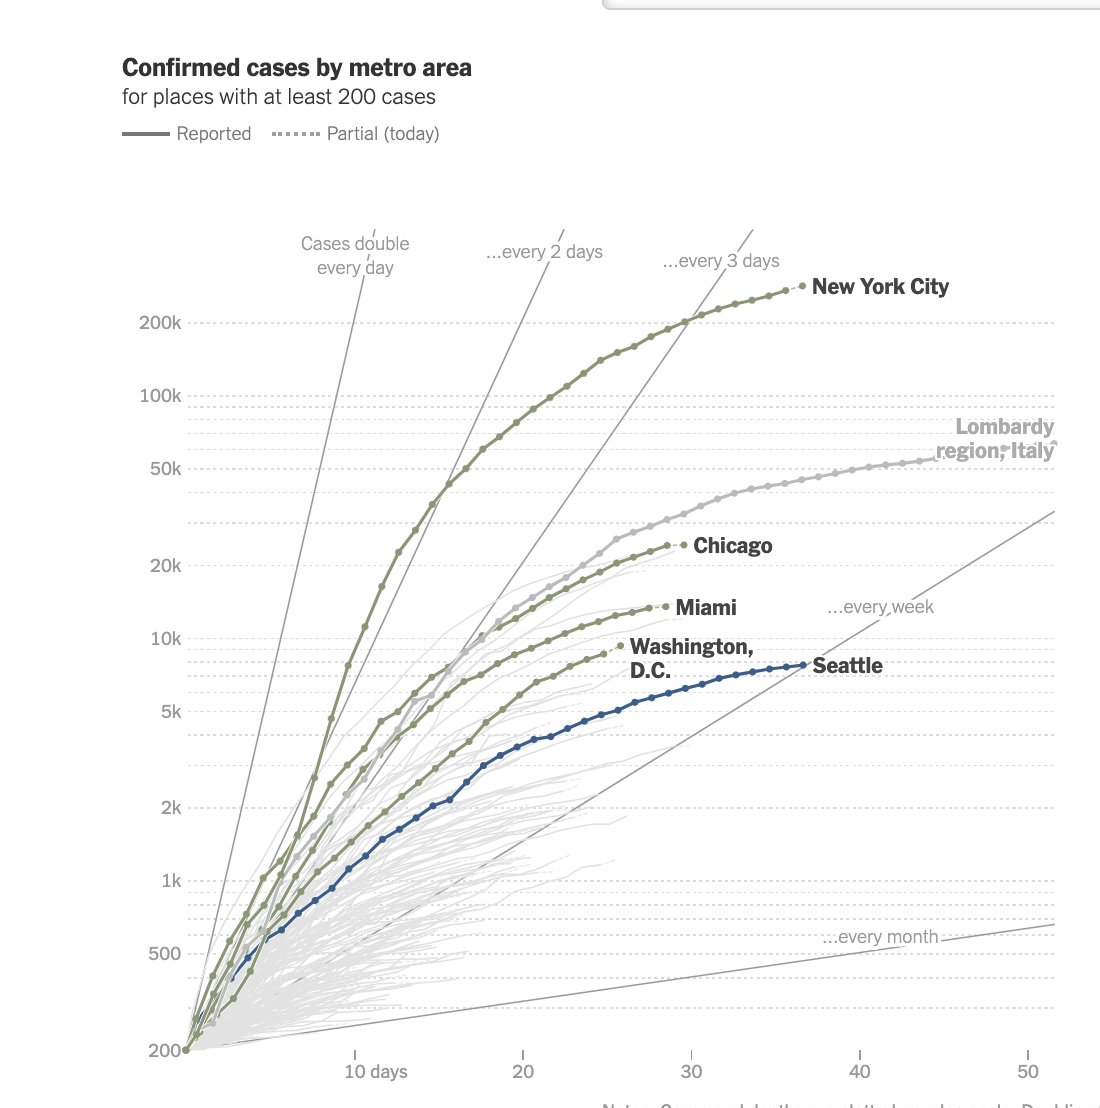
19/ On the positive side the curve has been flattening in case growth. That is great news, and proves that the physical distancing we have all been doing is WORKING
But we are massively undercounting the # of cases, and if we loosen up, all those undiagnosed cases will spread it
But we are massively undercounting the # of cases, and if we loosen up, all those undiagnosed cases will spread it
20/ Why do I think we are under-counting the cases?
The ratio between the number of cases and the number of deaths.
here's the latest from the NYT
That's a 4.6% CFR- but we know that the deaths are undercounted by at least 2x (remember NYC)
And the deaths lag too...
The ratio between the number of cases and the number of deaths.
here's the latest from the NYT
That's a 4.6% CFR- but we know that the deaths are undercounted by at least 2x (remember NYC)
And the deaths lag too...
21/ So you have to account for all the deaths that will happen among the cases by the time they finally resolve one way or another, and for this disease, it can take a month or more before the patient is either cured or dead, so another undercounting
ncbi.nlm.nih.gov/pmc/articles/P…
ncbi.nlm.nih.gov/pmc/articles/P…
22/ But if we assume ~1% CFR and 2,000 official deaths a day now --> 4,000 likely deaths a day --> we have been having 400,000 new cases a day not 30,000
I think we are undercounting cases by 10x+
before we start talking about opening up, we need to get diagnoses up, CFR ~1%
I think we are undercounting cases by 10x+
before we start talking about opening up, we need to get diagnoses up, CFR ~1%
23/ Let me say that again. All the plans are talking about switching in contact tracing as the number of cases decline, so we can start to relax social restrictions without the outbreak flaring
But that only works if you are diagnosing most of the cases
Only loosen when CFR ~1%
But that only works if you are diagnosing most of the cases
Only loosen when CFR ~1%
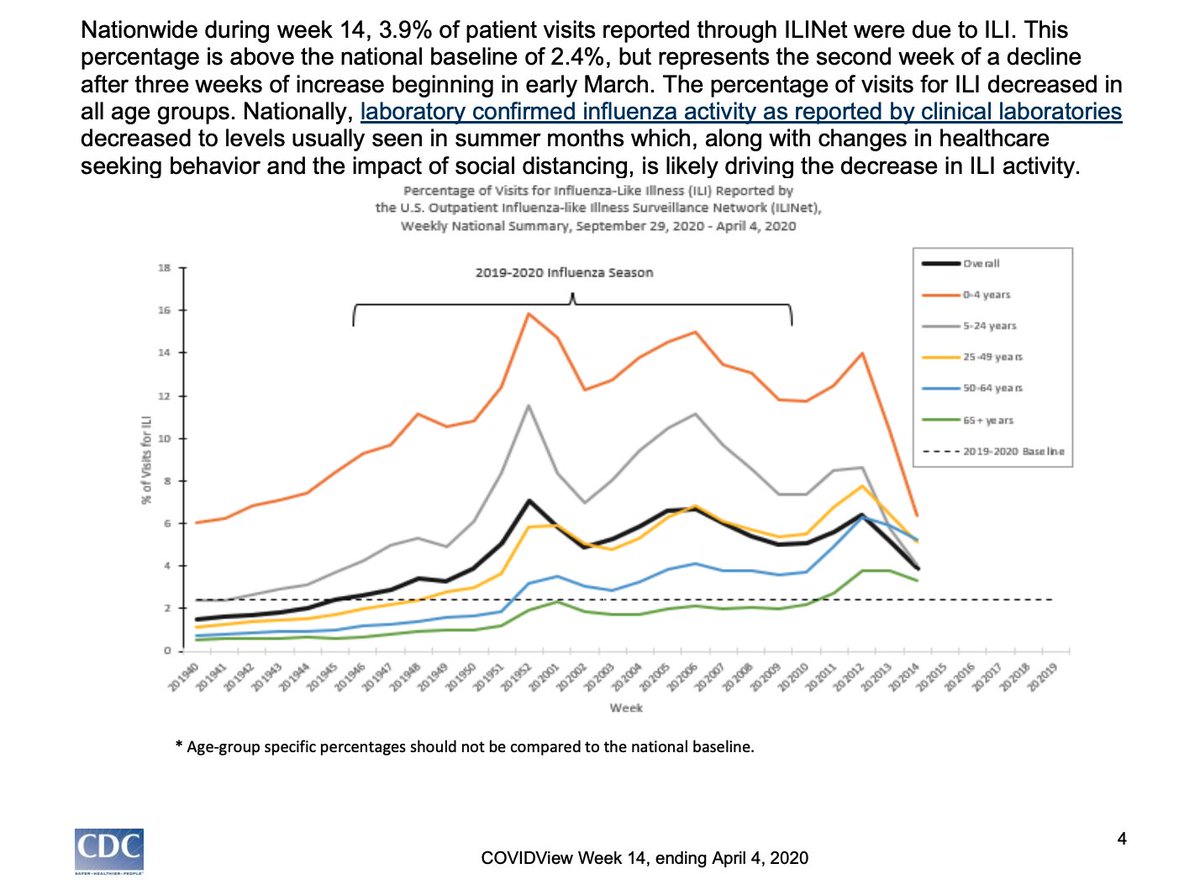
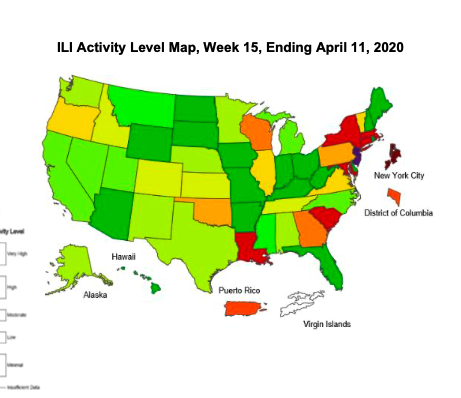
24/ So what gives the WH/Dr Birx confidence that the outbreak has turned in most of the US?
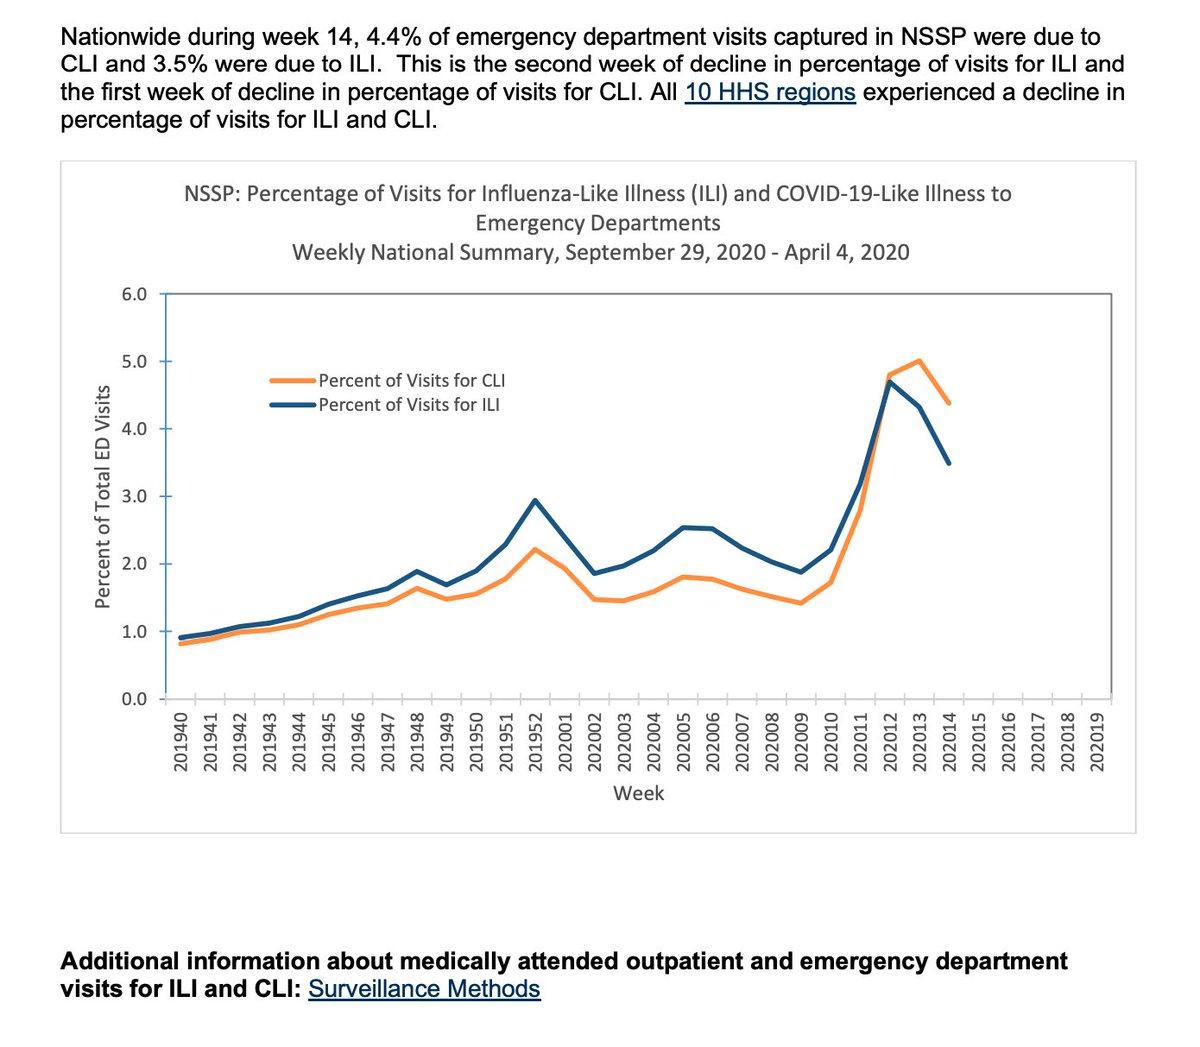
Syndromic surveillance: ILINet tracks Influenza-like Illness at ~2,600 primary care providers, EDs, Urgent Care in all 50 states
See flu spike twice? then COVID spike..and come down
Syndromic surveillance: ILINet tracks Influenza-like Illness at ~2,600 primary care providers, EDs, Urgent Care in all 50 states
See flu spike twice? then COVID spike..and come down
25/ Here's another type of syndromic surveillance - this one from emergency departments reporting to state/local health departments, and aggregated by CDC.
ILI's coming down.
(If you're interested in my history with this surveillance system, see here )
ILI's coming down.
(If you're interested in my history with this surveillance system, see here )
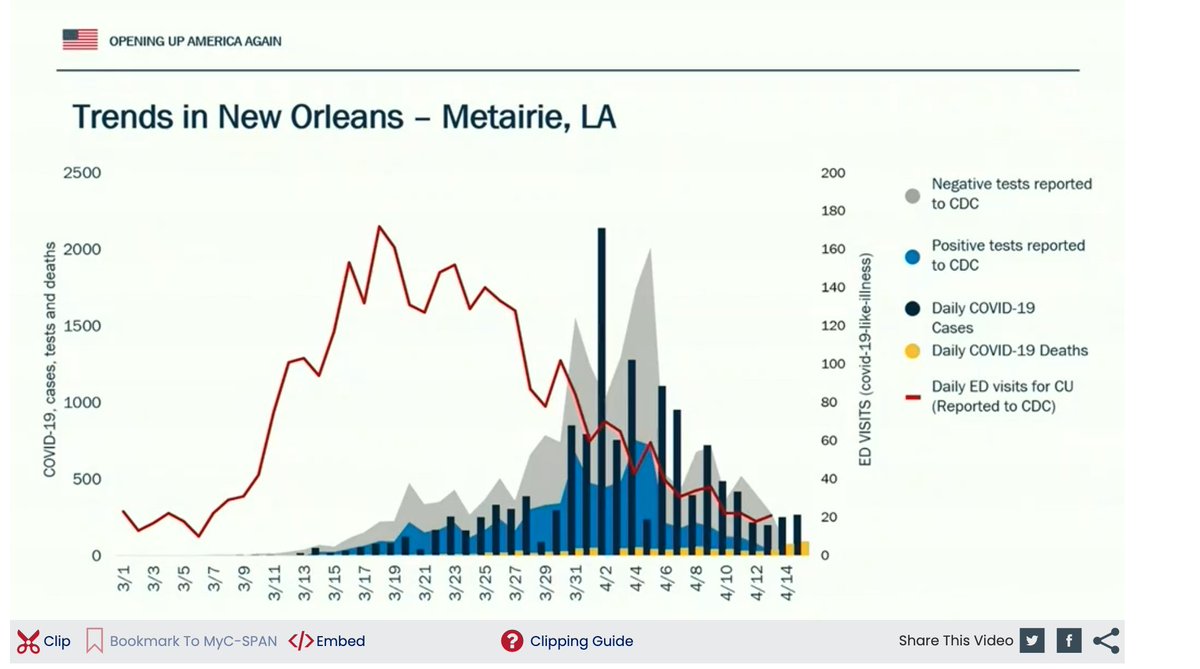
26/ Dr Birx showed this graph from Louisiana-syndromic surveillance vs diagnosed cases-yesterday.
I was so proud. You can see ED visits (red line) spiking as undiagnosed people went to ED w flu-like symptoms, and receding by the time diagnosed cases peak (more testing!)
I was so proud. You can see ED visits (red line) spiking as undiagnosed people went to ED w flu-like symptoms, and receding by the time diagnosed cases peak (more testing!)
27/ If you trust this data, it looks like the outbreak may indeed be receding across most of the US. That's the source of a lot of the confidence you are hearing in their voices
I agree. I think we will see cases decline in next 2 weeks, and deaths 2-3 weeks after
but caveats..
I agree. I think we will see cases decline in next 2 weeks, and deaths 2-3 weeks after
but caveats..
28/ Caveat
ILINet is too coarse to see small outbreaks begin to flare. You need to apply statistical methods to the ED data for that, and I haven't seen states (ex NYC) publicly showing that data.
*Every governor should be asked about their ED surveillance clusters every day*
ILINet is too coarse to see small outbreaks begin to flare. You need to apply statistical methods to the ED data for that, and I haven't seen states (ex NYC) publicly showing that data.
*Every governor should be asked about their ED surveillance clusters every day*
29/ Caveat.
It could be that people are avoiding outpatient centers and doctors offices and EDs for their cough/ fever due to fear, social distancing.
These signals need to be investigated.
By real public health epidemiologists.
who are local.
It could be that people are avoiding outpatient centers and doctors offices and EDs for their cough/ fever due to fear, social distancing.
These signals need to be investigated.
By real public health epidemiologists.
who are local.
30/ If we are eager to use these syndromic surveillance indicators to give hope, begin to loosen restrictions, we must also be alert to any flare-ups after we loosen, and investigate, and shut back down
I fear that they will be used in one direction but not the other->lives lost
I fear that they will be used in one direction but not the other->lives lost