RSI Simplified📒
🔵Its one of the leading indicator which measures the strength of any move in price
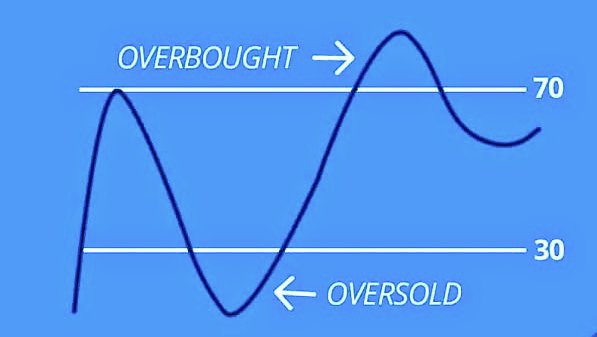
🔵Its an oscillator which moves between two extremes (0—100)
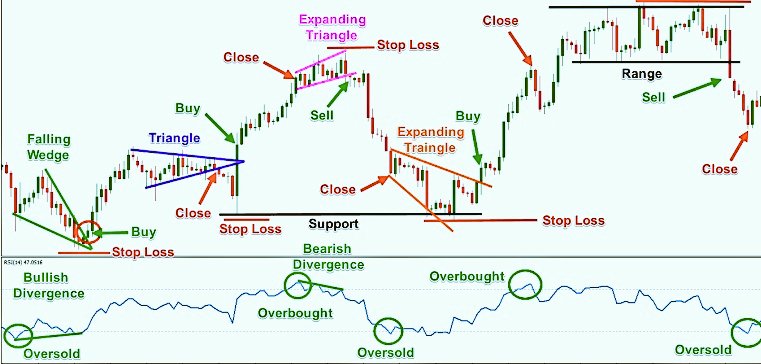
🔵Reading above 70 indicates overbought while below 30 indicates oversold sentiments
1/n
#StockMarket #Technicals
🔵Its one of the leading indicator which measures the strength of any move in price
🔵Its an oscillator which moves between two extremes (0—100)
🔵Reading above 70 indicates overbought while below 30 indicates oversold sentiments
1/n
#StockMarket #Technicals
RSI Simplified📒
Trading Divergences📈
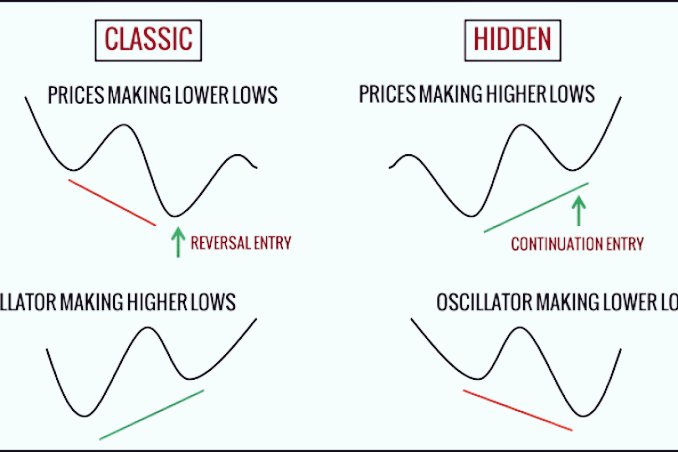
🔵There are 2 type of divergences occurs b/w RSI&Price (Bullish & Bearish)
🔵In Bullish Divergence RSI makes HH-HL while price doesn't do it
🔵In Bearish Divergence RDI makes LH-LL while price doesn't do it
3/n
#StockMarket #Technicals
Trading Divergences📈
🔵There are 2 type of divergences occurs b/w RSI&Price (Bullish & Bearish)
🔵In Bullish Divergence RSI makes HH-HL while price doesn't do it
🔵In Bearish Divergence RDI makes LH-LL while price doesn't do it
3/n
#StockMarket #Technicals
RSI Simplified📒
Trading Checklist for RSI
🔵 Buy on bullish or positive divergences
🔵 Sell on Bearish or negative divergences
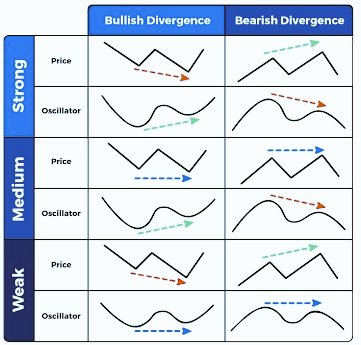
🔵 Wait if divergence is very low in nature
🔵 Remember more the divergence better the success rate of trade
4/n
#StockMarket #Technicals
Trading Checklist for RSI
🔵 Buy on bullish or positive divergences
🔵 Sell on Bearish or negative divergences
🔵 Wait if divergence is very low in nature
🔵 Remember more the divergence better the success rate of trade
4/n
#StockMarket #Technicals
RSI Simplified📒
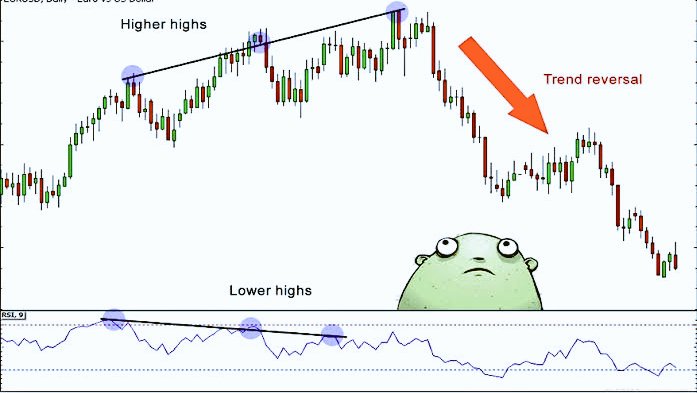
📈Case Study💡
🔵We can see RSI bearish or negative divergence in the pic
🔵RSI cont. making LL-LH pattern while price is making HH-HL pattern (Selling or Profit Booking zone)
🔵It is often considered as fake move as well in ST charts
End of Thread
Thanks🙏
📈Case Study💡
🔵We can see RSI bearish or negative divergence in the pic
🔵RSI cont. making LL-LH pattern while price is making HH-HL pattern (Selling or Profit Booking zone)
🔵It is often considered as fake move as well in ST charts
End of Thread
Thanks🙏