My Authors
Read all threads
Analysis: #NASDAQ $ANTM

Case 264 #Anthem Inc.

DISCLAIMER: The analysis is strictly for educational purposes and should not be construed as an invitation to trade.

#ANTM 1/4
Chart 1
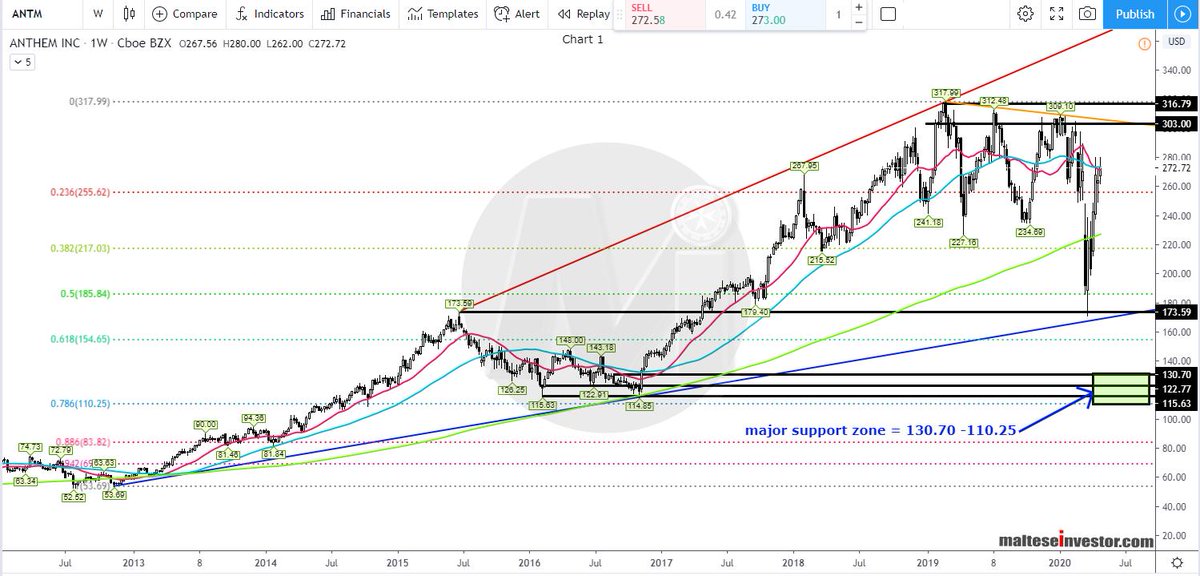
Weekly Chart: The all time high of 317.99 was recorded in Feb. 2019 and from then price action was confined to an $80 range. Last month's strong move down took price way past the bottom of the range, traded below the #SMA 200 (first time since .....

ANTM 2/4
..... 2012) and rebounded strongly on #Fib 0.50 and 2015 peak with long term #trendline #support further down.

ANTM 3/4
Chart 2
Daily Chart: A two day close below 235.60 is #bearish. A break below 158.50 will expose the vacuum and target 132.70-130.00

The #Strategy is printed on the image.

$ANTM
Missing some Tweet in this thread? You can try to force a refresh.

Enjoying this thread?

Keep Current with malteseinvestor

Profile picture

Stay in touch and get notified when new unrolls are available from this author!

Read all threads

This Thread may be Removed Anytime!

Twitter may remove this content at anytime, convert it as a PDF, save and print for later use!

Try unrolling a thread yourself!

how to unroll video

1) Follow Thread Reader App on Twitter so you can easily mention us!

2) Go to a Twitter thread (series of Tweets by the same owner) and mention us with a keyword "unroll" @threadreaderapp unroll

You can practice here first or read more on our help page!

Follow Us on Twitter!

Did Thread Reader help you today?

Support us! We are indie developers!


This site is made by just two indie developers on a laptop doing marketing, support and development! Read more about the story.

Become a Premium Member ($3.00/month or $30.00/year) and get exclusive features!

Become Premium

Too expensive? Make a small donation by buying us coffee ($5) or help with server cost ($10)

Donate via Paypal Become our Patreon

Thank you for your support!