Two weeks later and ‘retail’ sentiment is still weak (-29%). Same conclusion $spx
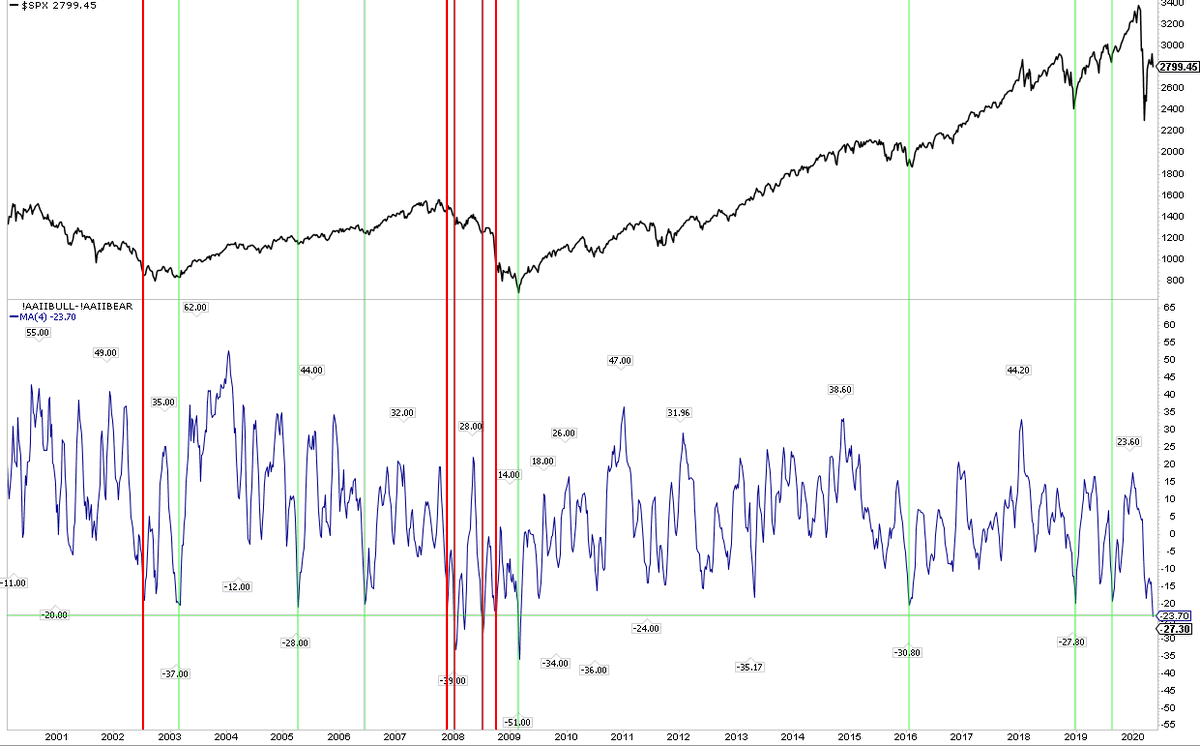
4 week retail sentiment (AAII) now lowest since March 2009. Meaningful in a bull market, not in a bear market
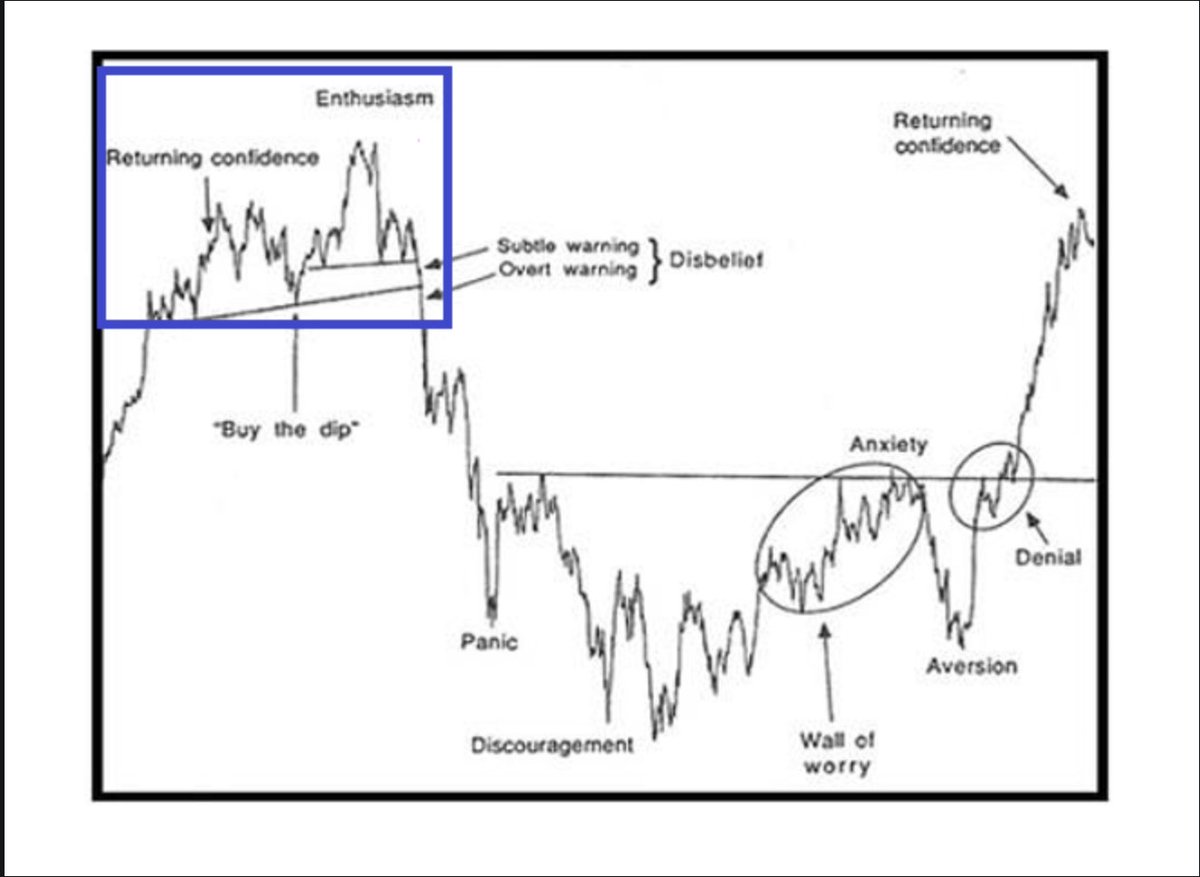
 Image
Sentiment round-up
Bearish: AAII, Consensus, fund flows, Fear & Greed
Bullish: II, Panic/Euphoria, one-month CPCE
Neutral: NAAIM, DSI, 10-day CPCE
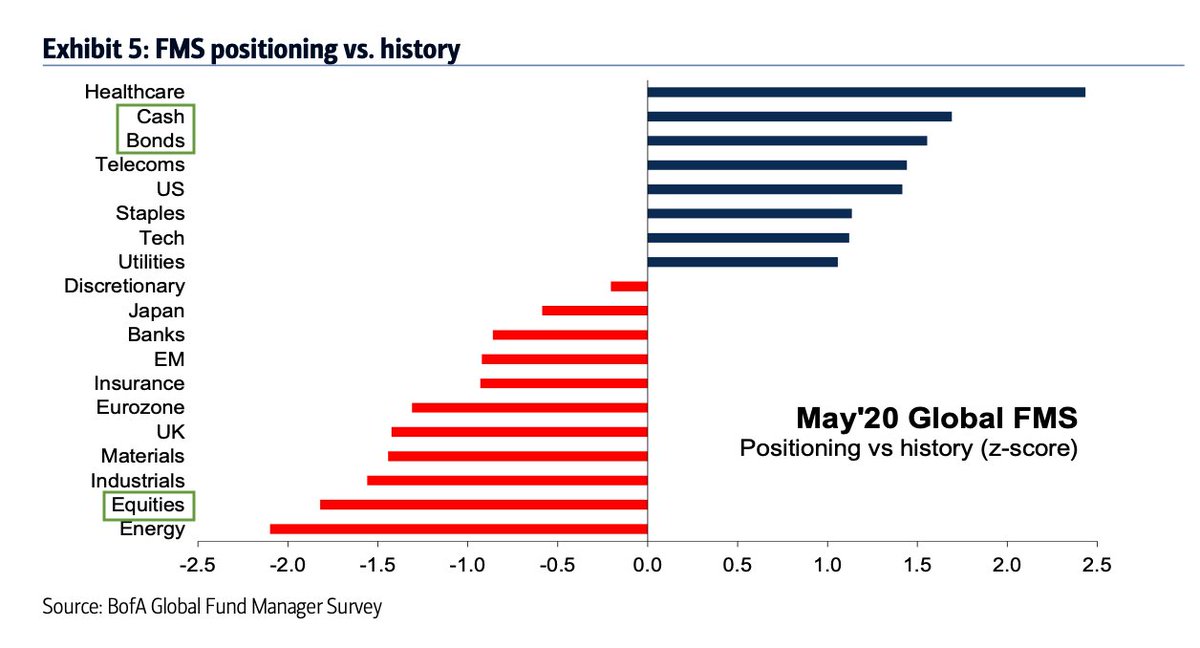
Fund managers surveyed by BAML:
- High cash (5.7%)
- Bond weight highest in 10 yrs
- Still high equity underweight (1.8% std dev below mean)
- Within equities: US weight highest in 5 yrs, Europe lowest in 8 yrs (flight to safety) Image
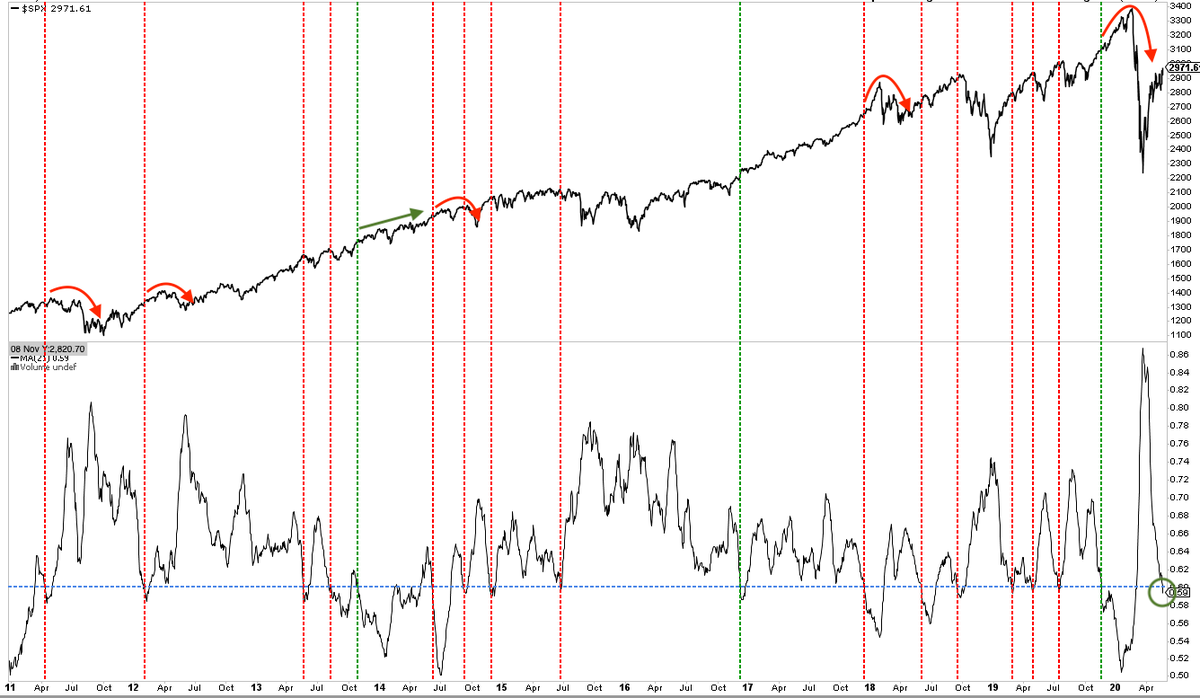
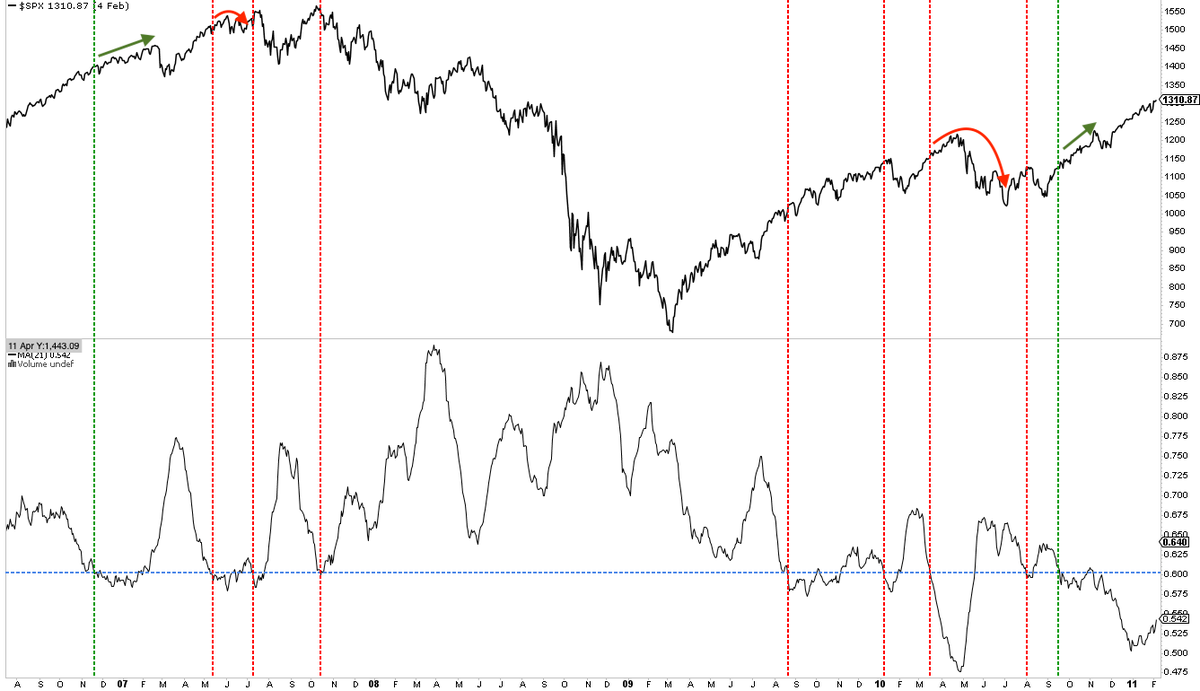
One month equity only put/call (0.59) at a level where $SPX often runs into some turbulence. If it runs higher now, those gains usually (but not always) given back ImageImage

• • •

Missing some Tweet in this thread? You can try to force a refresh
 

Keep Current with Urban Carmel

Urban Carmel Profile picture

Stay in touch and get notified when new unrolls are available from this author!

Read all threads

This Thread may be Removed Anytime!

PDF

Twitter may remove this content at anytime! Save it as PDF for later use!

Try unrolling a thread yourself!

how to unroll video
  1. Follow @ThreadReaderApp to mention us!

  2. From a Twitter thread mention us with a keyword "unroll"
@threadreaderapp unroll

Practice here first or read more on our help page!

More from @ukarlewitz

12 Aug 20
This valuation chart from Bloomberg is making the rounds, showing that world equities are overvalued because they exceed world GDP, like 2007, 2017 and the start of this year Image
Here’s a slightly longer term perspective, back to 1980, which shows that it was also overvalued (by slightly more) in 1999 Image
More than half of world equity market cap is just the US, so it’s a good barometer for the world. Here’s an even longer time series, back to 1950 from Doug Short Image
Read 10 tweets
28 May 20
Sentiment round-up
Bearish (-1): AAII, fund flows, BAML FMS
Bullish (+1): II, Panic/Euphoria, DSI, 10-day CPCE, one-month CPCE, NAAIM
Neutral (-1): Fear & Greed, Consensus

1 more measure moved up into the bull camp this week
10-day equity-only put/call now at 0.53. Since 2004, a >5% drawdown was ahead, or if ran higher, all gains given back. It could take weeks to unfold Image
Read 33 tweets
27 May 20
My stream went from breadth is terrible to breath is beautiful in the span of a week.

The low was 45 days ago and the Wilshire 5k is up 35% so a 50-d moving average will show a lot of stocks are above it. That’s how math works
Careful with ‘strong breadth’.

Similar breath (~90% above 50-d) preceded two long sideways periods in 2004-05.

85% of was above its 50-d at the Oct 2007 top. That’s objectively strong breadth Image
(Cont). Likewise, strong breadth preceded three different harsh corrections in the past 10 years Image
Read 16 tweets
24 Apr 20
Plunge and bounce. All the market is doing now is debating whether we’ll be on the red line or the green line next year
Everyone has an opinion on red vs green. Objectively, there is no way to have any degree of certainty given the large number of unknowns Image
Insiders have likewise acknowledged this Image
Read 48 tweets
17 Mar 20
Breadth has been so bad that Summation (momentum) will drop -1000 tomorrow, just the 6th time in 20 years. Marked the low in 2019 and 2009, the initial low in 2002 and the start of July 2008 rally. It also meant nothing during the Oct 2008 panic Image
Summation keeps falling until turns positive; in other words, aside from Oct 2008, this is about the time when a series of accumulation days (>3:1) start. Last time was positive was Feb 20 ($SPX peaked Feb 19)
Two more Summation -1000 occurrences in 1998 and 1999. All except the last one (Dec 2018) gave way to a lower low in in the following weeks. Momentum takes time to work off
Read 10 tweets
13 Mar 20
The only modern comparable to now is 1987
- fell 20% in one day, rose 15% the next 2 days, then returned to the low the following week
- Then rose 15% again and then retested the original low 6 weeks later
- It was up 25% a year later and back at prior highs 2 years later Image
Yesterday, worst 1 day drop for and in their history, and ATH closing high. Wild guess: that was ‘Panic’. ‘Discouragement’ requires time and a failed bounce. 1987 was similar to this (scroll up). Chart h/t @hmeisler Image
Read 14 tweets

Did Thread Reader help you today?

Support us! We are indie developers!


This site is made by just two indie developers on a laptop doing marketing, support and development! Read more about the story.

Become a Premium Member ($3/month or $30/year) and get exclusive features!

Become Premium

Too expensive? Make a small donation by buying us coffee ($5) or help with server cost ($10)

Donate via Paypal Become our Patreon

Thank you for your support!

Follow Us on Twitter!