
AAII Sentiment survey update:
(Bullish - Bearish) spread just reached a cycle low last week.
See the contrarian nature of this indicator.
Dec, Jan, Feb = Green = bullish > bearish
Mar, Apr, May = Red = bearish > bullish
(Bullish - Bearish) spread just reached a cycle low last week.
See the contrarian nature of this indicator.
Dec, Jan, Feb = Green = bullish > bearish
Mar, Apr, May = Red = bearish > bullish

AAII sentiment survey chart from 2010 to 2020:
Interesting:
1 notice all the "bull-bear spread lows" in the past?
(huge pessimism)
2 just before a major up-trend..
3. this time is different? (not good) 🤔🧐
Interesting:
1 notice all the "bull-bear spread lows" in the past?
(huge pessimism)
2 just before a major up-trend..
3. this time is different? (not good) 🤔🧐

Don't panic. bears
I trust more on what they DO, not what they SAY
what they do? CNN fear & Greed index from the trading
what they say? AAII survey
When in conflict, trust
1 CNN fear & greed index
2 & VX furures term structure
3 Equity Put/Call ratio
4 Volume divergence
I trust more on what they DO, not what they SAY
what they do? CNN fear & Greed index from the trading
what they say? AAII survey
When in conflict, trust
1 CNN fear & greed index
2 & VX furures term structure
3 Equity Put/Call ratio
4 Volume divergence

The above "what they do" list, showing:
1 neutral (CNN)
2 complacent (VIX TS)
3 "mild" greed (Equity PCR & Volume divergence)
Plus many breadth divergences
- most important hidden sentiment: what smart money has been doing under the radar
I report, you decide. 🧐😎
1 neutral (CNN)
2 complacent (VIX TS)
3 "mild" greed (Equity PCR & Volume divergence)
Plus many breadth divergences
- most important hidden sentiment: what smart money has been doing under the radar
I report, you decide. 🧐😎
below thread in Jan leading to the market crash in Feb/Mar
F&G reached 97 (intra-day 98) on Jan 2🧐
In Fed we trust
Repo & notQE in full swing
near ZIRP
Tons of liquidity
SPX won't be allowed to drop 10 pts in election year
In Trump we trust
FOMO buy👌😷
F&G reached 97 (intra-day 98) on Jan 2🧐
In Fed we trust
Repo & notQE in full swing
near ZIRP
Tons of liquidity
SPX won't be allowed to drop 10 pts in election year
In Trump we trust
FOMO buy👌😷

Below is much more accurate than AAII sentiment survey from my backtesting
Total Equity Put/Call ratio from all 16 options exchanges.
not CBOE put/call ratio that I post everyday
CBOE is about 12% of all equity options & 98% of all Index options
Total Equity Put/Call ratio from all 16 options exchanges.
not CBOE put/call ratio that I post everyday
CBOE is about 12% of all equity options & 98% of all Index options
CBOE Call/Put Ratio (PCR reversed) 10d SMA
Euphoria and capitulation zones defined.
Not as accurate as above "total equity call/put ratio", but, a very good contrarian indicator around the turning levels.
Need confluence from other cross-asset & breadth & sentiment indicators
Euphoria and capitulation zones defined.
Not as accurate as above "total equity call/put ratio", but, a very good contrarian indicator around the turning levels.
Need confluence from other cross-asset & breadth & sentiment indicators

Total equity call/put ratio from 16 exchanges
Updated as of Fri, May 8 2020
neutral & complacent
BTFD at capitulation zone is more accurate than top picking
Top picking need other confluence from cross-asset & breadth & sentiment indicators. (I have more than 50+ combined)
Updated as of Fri, May 8 2020
neutral & complacent
BTFD at capitulation zone is more accurate than top picking
Top picking need other confluence from cross-asset & breadth & sentiment indicators. (I have more than 50+ combined)

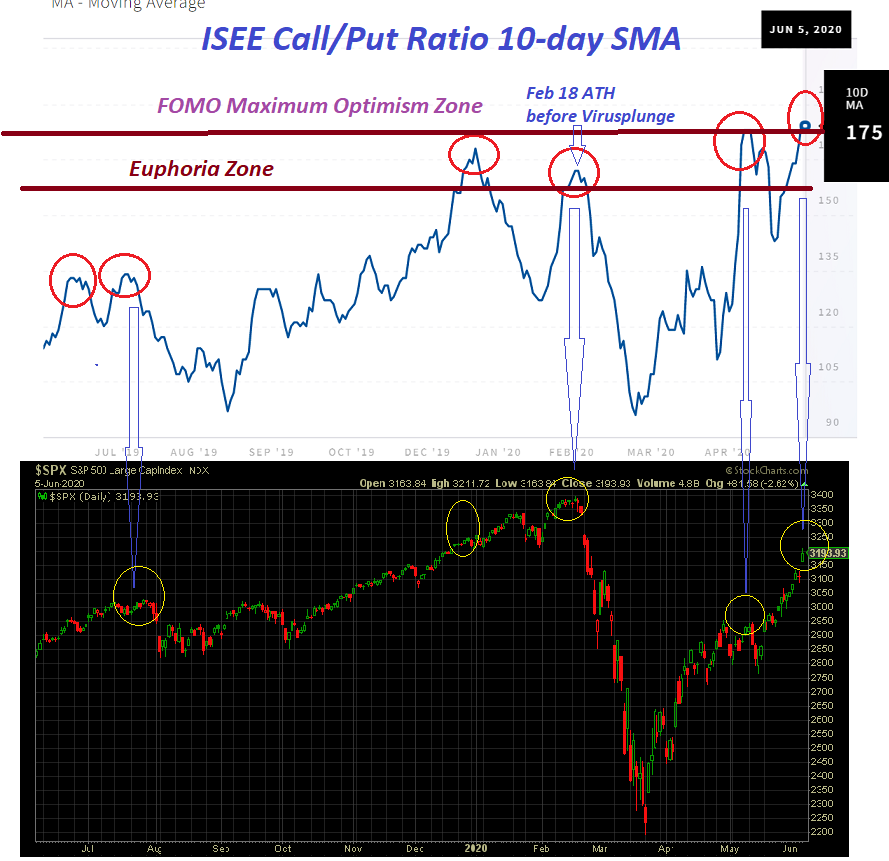
ISEE Call/Put ratio: 10d sma
MMs & firm trades, excluded, are not considered representative of true market sentiment due to their specialized nature. ISEE method allows for a more accurate measure of true investor sentiment than traditional P/C ratios
Now higher than Dec & Jan
MMs & firm trades, excluded, are not considered representative of true market sentiment due to their specialized nature. ISEE method allows for a more accurate measure of true investor sentiment than traditional P/C ratios
Now higher than Dec & Jan

Interesting chart.
Reverse-split adjusted price.
$950 in Oct 2007 - amazing.
and the volume last week? 30x avg volume (20 day)
Reverse-split adjusted price.
$950 in Oct 2007 - amazing.
and the volume last week? 30x avg volume (20 day)

BDI leading indicator: predicted Oil plunge in Jan 2020.
6 Reasons Why Goldman Sees The S&P Sliding Back To 2,400 By August
"There are a number of concerns and risks exist that we believe, and our client discussions confirm, investors are downplaying."
- Wait, that's my target. Haha. following me? 😎🤔
zerohedge.com/markets/6-reas…
"There are a number of concerns and risks exist that we believe, and our client discussions confirm, investors are downplaying."
- Wait, that's my target. Haha. following me? 😎🤔
zerohedge.com/markets/6-reas…
Old post:
I will need to change my 2,425 target because of 😷
I will need to change my 2,425 target because of 😷
See above thread regarding
1 CBOE p/c ratios (index, total, equity, ETP)
2 ISEE c/p ratio
3 total equity c/p ratio from all 16 exchg
I have new corr proof that is highly correlated with CBOE (equity p/c ratio) as shown below.
As good as from 512d to 10d corr
1 CBOE p/c ratios (index, total, equity, ETP)
2 ISEE c/p ratio
3 total equity c/p ratio from all 16 exchg
I have new corr proof that is highly correlated with CBOE (equity p/c ratio) as shown below.
As good as from 512d to 10d corr

Correlation table with other cross assets
512-day to 10-day correlation.
index (#AUDUSD also) is the new FX correlation star: highly correlated with from 128d to 30d
& are no brainer.
512-day to 10-day correlation.
index (#AUDUSD also) is the new FX correlation star: highly correlated with from 128d to 30d
& are no brainer.
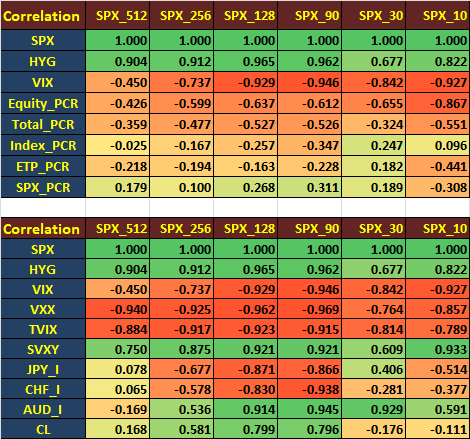
In statistics, the phrase "correlation does not imply causation" refers to inability to legitimately deduce a cause&effect relationship between 2 variables solely on the basis of an observed correlation
But, In trading, if you add more corre confluence, finding divergences👌🧐💯
But, In trading, if you add more corre confluence, finding divergences👌🧐💯
1 drawback of below corr matrix is: it can only display a single corr period
2 Need a 3D to see the corr overtime, finding the divergence from the norm in shorter timeframe
3 A corr table with diff periods among assets would easily spot div in real-time
2 Need a 3D to see the corr overtime, finding the divergence from the norm in shorter timeframe
3 A corr table with diff periods among assets would easily spot div in real-time
SPX:AUD chart: Friday's close.
More visual to spot the divergences and the "capitulation" & "euphoria" zones over time
A: 3 regression lines for more confluence
B: Euphoria zone in Dec, Jan & Feb
C: Capitulation Zone in Feb & Mar
D: Current position relative to the past 90 days
More visual to spot the divergences and the "capitulation" & "euphoria" zones over time
A: 3 regression lines for more confluence
B: Euphoria zone in Dec, Jan & Feb
C: Capitulation Zone in Feb & Mar
D: Current position relative to the past 90 days
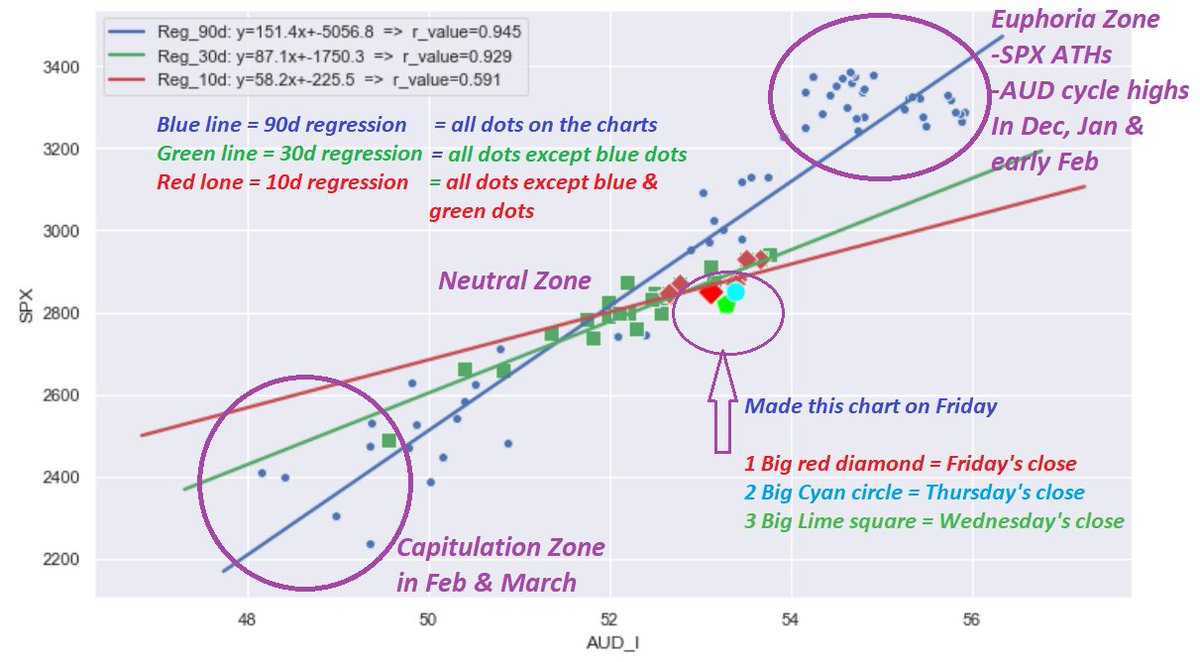
Trade the correlation/regression charts in swing & day/scalping trading
1 for swing trading, look for divergences in daily chart
2 for scalping, if last 10 days' dots were near regression line (correlated), looking for divergence in 15-min, confirmed by more cross-asset diverg🧐
1 for swing trading, look for divergences in daily chart
2 for scalping, if last 10 days' dots were near regression line (correlated), looking for divergence in 15-min, confirmed by more cross-asset diverg🧐
AAII bullish and Bearish weekly sentiment survey
from 2010 to 2020
6/5/2020 = Extreme Bearish
green = bullish
red = bearish
blue = 5-period SMA (spread) = bullish - bearish
from 2010 to 2020
6/5/2020 = Extreme Bearish
green = bullish
red = bearish
blue = 5-period SMA (spread) = bullish - bearish

AAII Sentiment survey update: 6/5/2020
(Bullish - Bearish) spread reached another cycle low last few weeks.
Since March, AAII survey turned "red"
🦃Super-duper "bullish" in Dec & Jan. 🦃
(Bullish - Bearish) spread reached another cycle low last few weeks.
Since March, AAII survey turned "red"
🦃Super-duper "bullish" in Dec & Jan. 🦃

Above AAII sentiment survey was "what they say"
Below CNN fear & greed indicator is "what they do"
Opposite direction. You decide
Fear & Greed Index = 66 = Greed 🦃
This thread from the top contains some useful info and million $ trading tips 👌🙃🤫
Below CNN fear & greed indicator is "what they do"
Opposite direction. You decide
Fear & Greed Index = 66 = Greed 🦃
This thread from the top contains some useful info and million $ trading tips 👌🙃🤫

Alert: Maximum Optimism: FOMO
Below is a more accurate ind than AAII sentiment survey from my backtesting: I am biased
Total equity call/put ratio from all 16 exchanges
not CBOE P/C ratio that I post daily
CBOE is about 14% of all equity options
All-In Maximum Optimism 🦃🦃
Below is a more accurate ind than AAII sentiment survey from my backtesting: I am biased
Total equity call/put ratio from all 16 exchanges
not CBOE P/C ratio that I post daily
CBOE is about 14% of all equity options
All-In Maximum Optimism 🦃🦃

Alert: Maximum optimism
ISEE C/P ratio: 10d sma
MM & firm trades, excluded, are not considered representative of true market sentiment due to their specialized nature. ISEE method allows for a more accurate measure of true investor sentiment than traditional P/C ratios
All-in
ISEE C/P ratio: 10d sma
MM & firm trades, excluded, are not considered representative of true market sentiment due to their specialized nature. ISEE method allows for a more accurate measure of true investor sentiment than traditional P/C ratios
All-in
To sum it up
Why would market crash?
1 "maximum FOMO optimism" just before the crash
2 irratianal exuberance drives stonks super overvaluation
3 taxi drivers all-in buying stonk calls
4 smart money on the other side waiting patiently
5 wealth transfer
Why would market crash?
1 "maximum FOMO optimism" just before the crash
2 irratianal exuberance drives stonks super overvaluation
3 taxi drivers all-in buying stonk calls
4 smart money on the other side waiting patiently
5 wealth transfer
Derivatives are zero-sum games
fut & stonk options are derivatives
For every buyer there is a seller
Who are on the other side of the trades?
dealers & smart money
When retails FOMO buying #ES_F & calls, smart money with deep pocket would just wait for the rug pull
fut & stonk options are derivatives
For every buyer there is a seller
Who are on the other side of the trades?
dealers & smart money
When retails FOMO buying #ES_F & calls, smart money with deep pocket would just wait for the rug pull


