My Authors
Read all threads
Analysis: #NYSE $TECK

Case 280 #Teck_Resources Limited

DISCLAIMER: The analysis is strictly for educational purposes and should not be construed as an invitation to trade.

#TECK 1/3
Chart 1
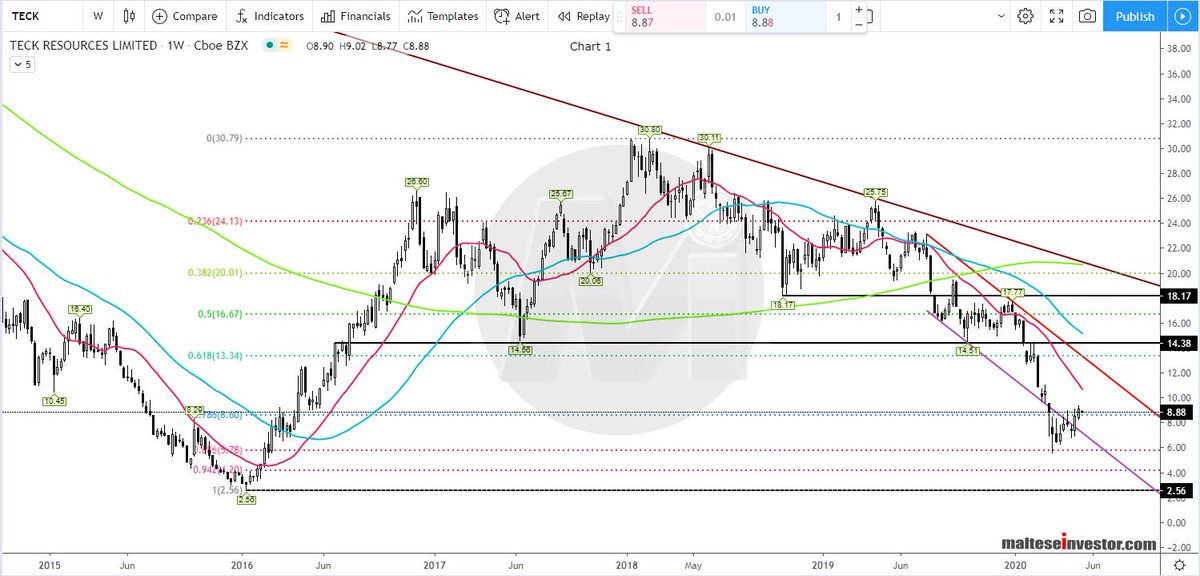
Weekly Chart: Price is revisiting the lows seen in 2016, the Fib 0.886 has contained the move down and price currently trades above the #Fib 0.786 at 8.60. Formidable #resistances appear at 12.90 (#pivot) then 13.34/44 (Fib 0.618 and #trendline) and 14.38/94.

TECK 2/3
Chart 2
Daily Chart: The #SMA 200 is currently at 14.12. Immediate #support at 7.60 then 6.22 - 5.60.

The #Strategy is printed on the image.

$TECK 3/3
Missing some Tweet in this thread? You can try to force a refresh.

Enjoying this thread?

Keep Current with malteseinvestor

Profile picture

Stay in touch and get notified when new unrolls are available from this author!

Read all threads

This Thread may be Removed Anytime!

Twitter may remove this content at anytime, convert it as a PDF, save and print for later use!

Try unrolling a thread yourself!

how to unroll video

1) Follow Thread Reader App on Twitter so you can easily mention us!

2) Go to a Twitter thread (series of Tweets by the same owner) and mention us with a keyword "unroll" @threadreaderapp unroll

You can practice here first or read more on our help page!

Follow Us on Twitter!

Did Thread Reader help you today?

Support us! We are indie developers!


This site is made by just two indie developers on a laptop doing marketing, support and development! Read more about the story.

Become a Premium Member ($3.00/month or $30.00/year) and get exclusive features!

Become Premium

Too expensive? Make a small donation by buying us coffee ($5) or help with server cost ($10)

Donate via Paypal Become our Patreon

Thank you for your support!