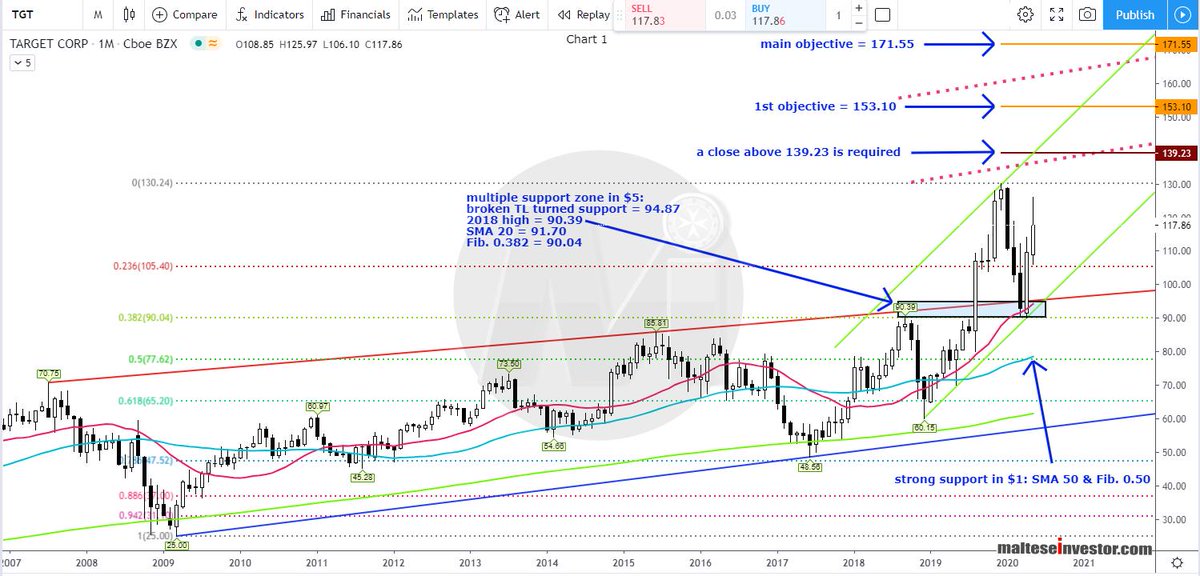
Monthly Chart: Following the all time high of 130.24 a sudden reversal ensued running into a multiple #support zone of $5 comprising of broken #trendline #resistance turned support, the 2018 high, SMA 50 with Fib. 0.382 marginally lower at 90.04. The .....
TGT 2/4
TGT 3/4

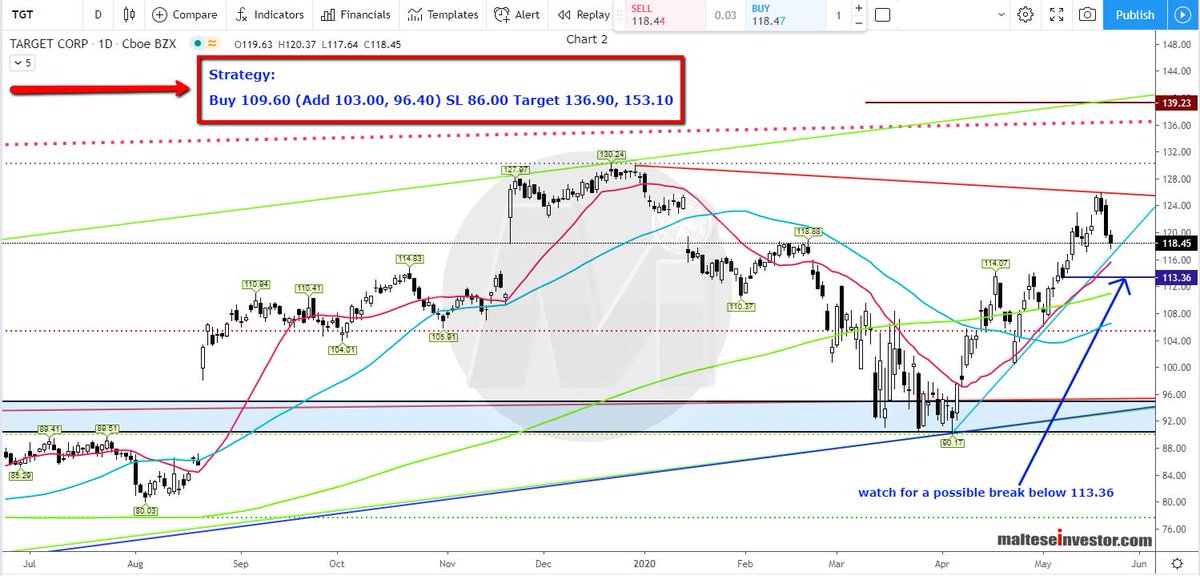
Daily Chart: Trendline support at 116.68 with SMA 20 at 115.60 - watch for a break below 113.36.
The #Strategy is printed on the image.
$TGT 4/4


