Analysis: #NASDAQ $CARA
Case 300 #Cara_Therapeutics Inc.
DISCLAIMER: The analysis is strictly for educational purposes and should not be construed as an invitation to trade.
#CARA 1/4
Case 300 #Cara_Therapeutics Inc.
DISCLAIMER: The analysis is strictly for educational purposes and should not be construed as an invitation to trade.
#CARA 1/4
Chart 1
Weekly Chart: Price has been trading in a $13 range for most of it's time in the last 3 years and has failed to close above the weekly closing #trendline since 2017 - unless this happens expect further range-bound activity to .....
CARA 2/4
Weekly Chart: Price has been trading in a $13 range for most of it's time in the last 3 years and has failed to close above the weekly closing #trendline since 2017 - unless this happens expect further range-bound activity to .....
CARA 2/4
..... continue in the future. An attempt is currently underway to reclaim trendline #support turned #resistance and upside #momentum will pick up on a close above 19.83 to target #pivot resistance at 24.60 then the vacuum top at 27.10.
CARA 3/4
CARA 3/4
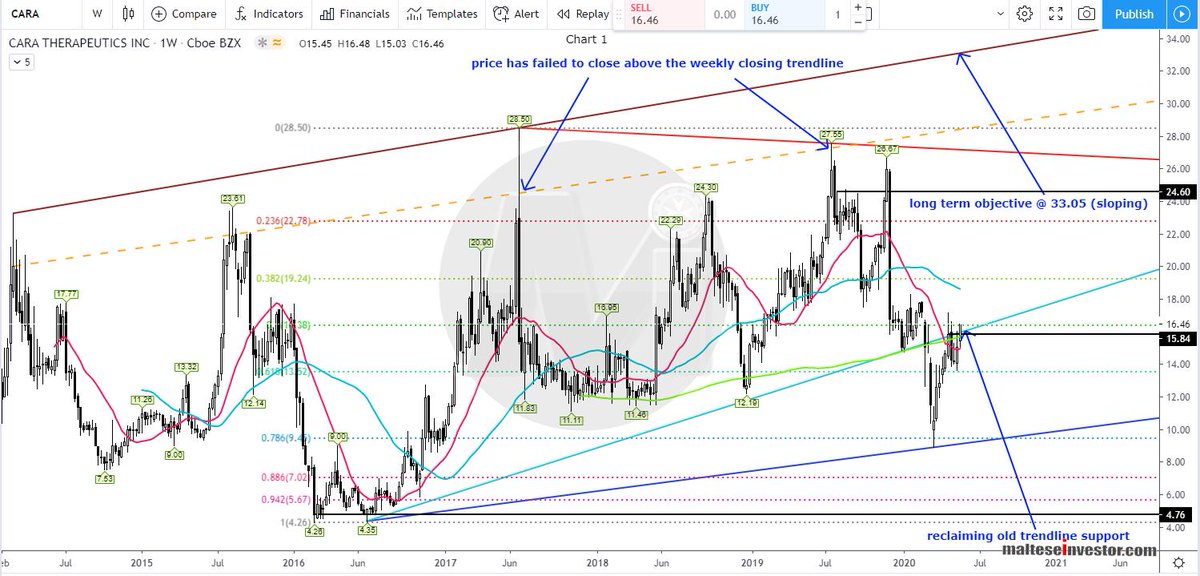
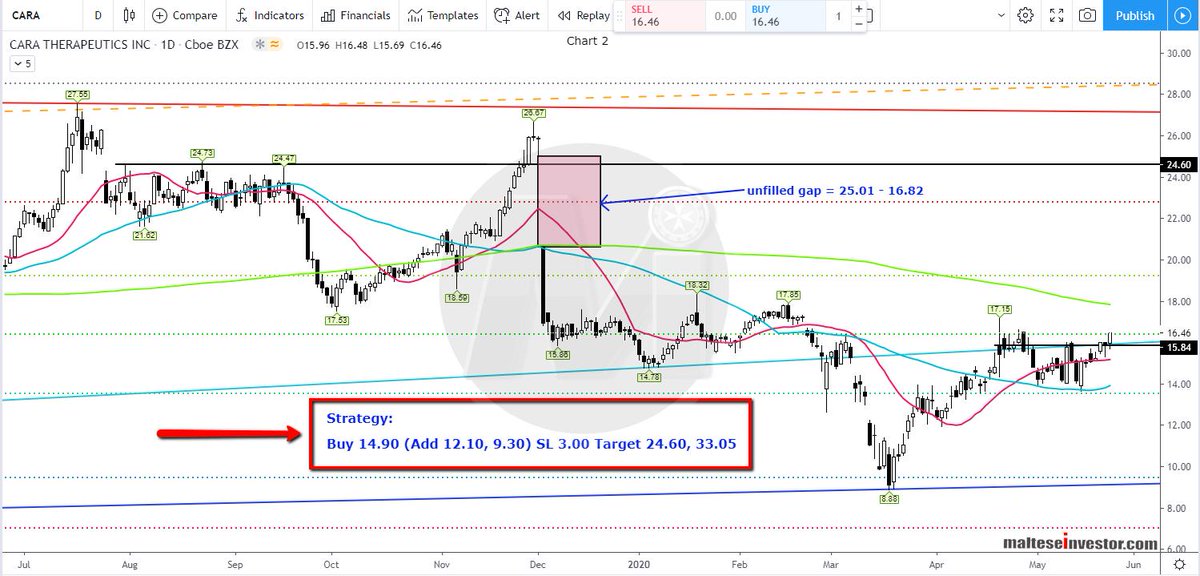
Chart 2
Daily Chart: An unfilled gap exists at 25.01 - 16.82.
The #Strategy is printed on the image.
$CARA
Daily Chart: An unfilled gap exists at 25.01 - 16.82.
The #Strategy is printed on the image.
$CARA