Chart 1
Weekly Chart: Good #support found at the 2009 #trendline coupled by an upside #momentum build enabled the break above long term trendline #resistance but price action has become very messy in 2020. .....
CPB 2/4
Weekly Chart: Good #support found at the 2009 #trendline coupled by an upside #momentum build enabled the break above long term trendline #resistance but price action has become very messy in 2020. .....
CPB 2/4
..... #Pivot resistances seen at 54.95 and 59.90 - a clean break and hold above the latter is required. Expecting volatility and chop to increase further up.
CPB 3/4
CPB 3/4
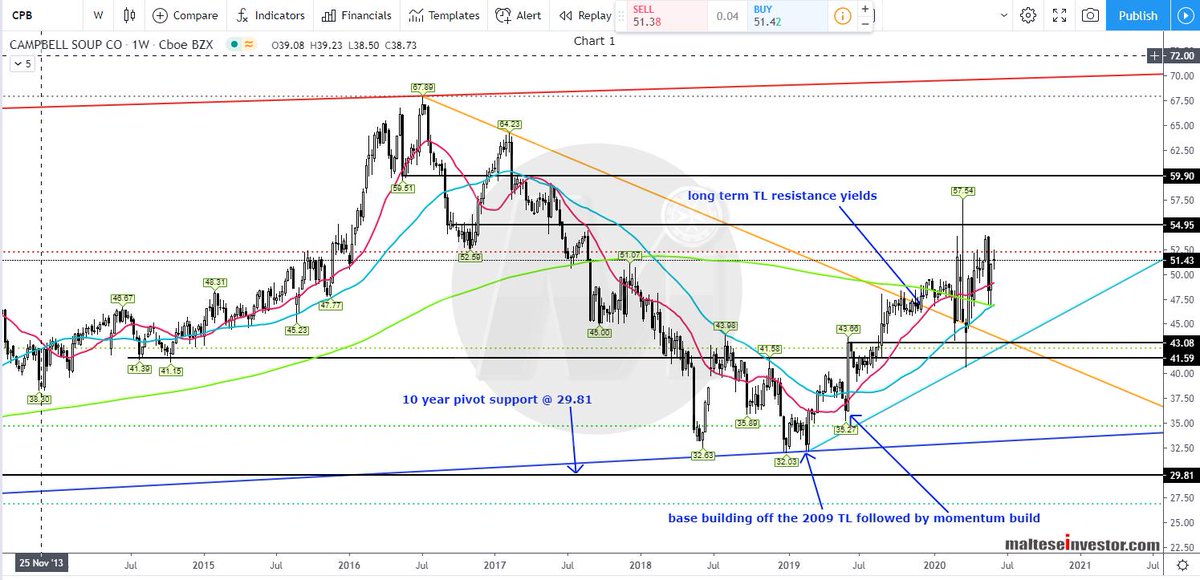
Chart 2
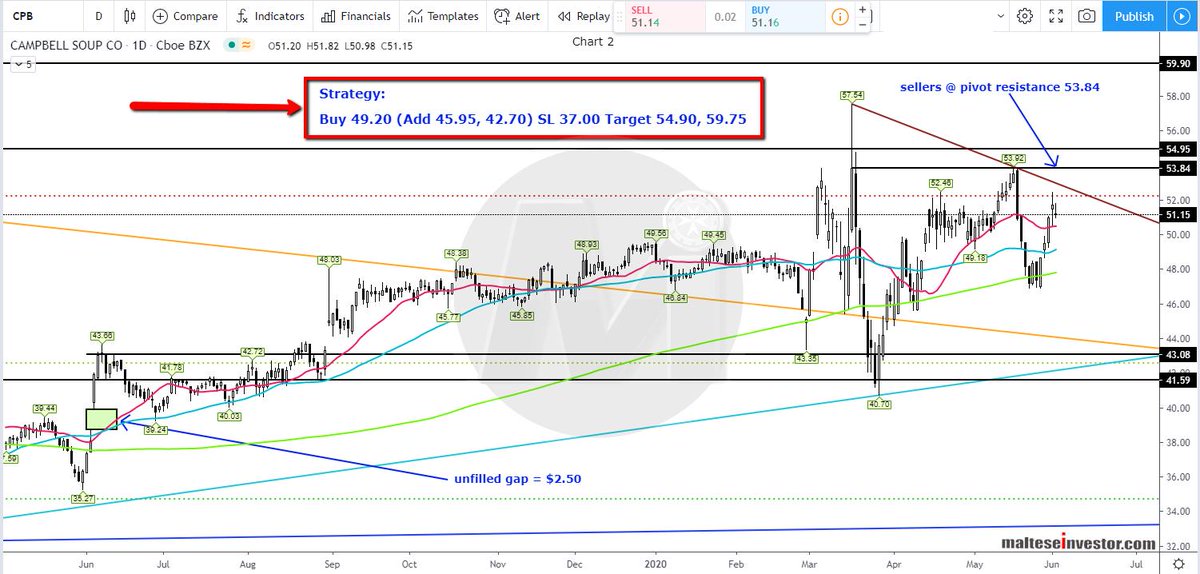
Daily Chart: Sellers at the pivot resistance 53.83 and now trading is confined to a triangle within an $8 range.
The #Strategy is printed on the image.
$CPB 4/4
Daily Chart: Sellers at the pivot resistance 53.83 and now trading is confined to a triangle within an $8 range.
The #Strategy is printed on the image.
$CPB 4/4