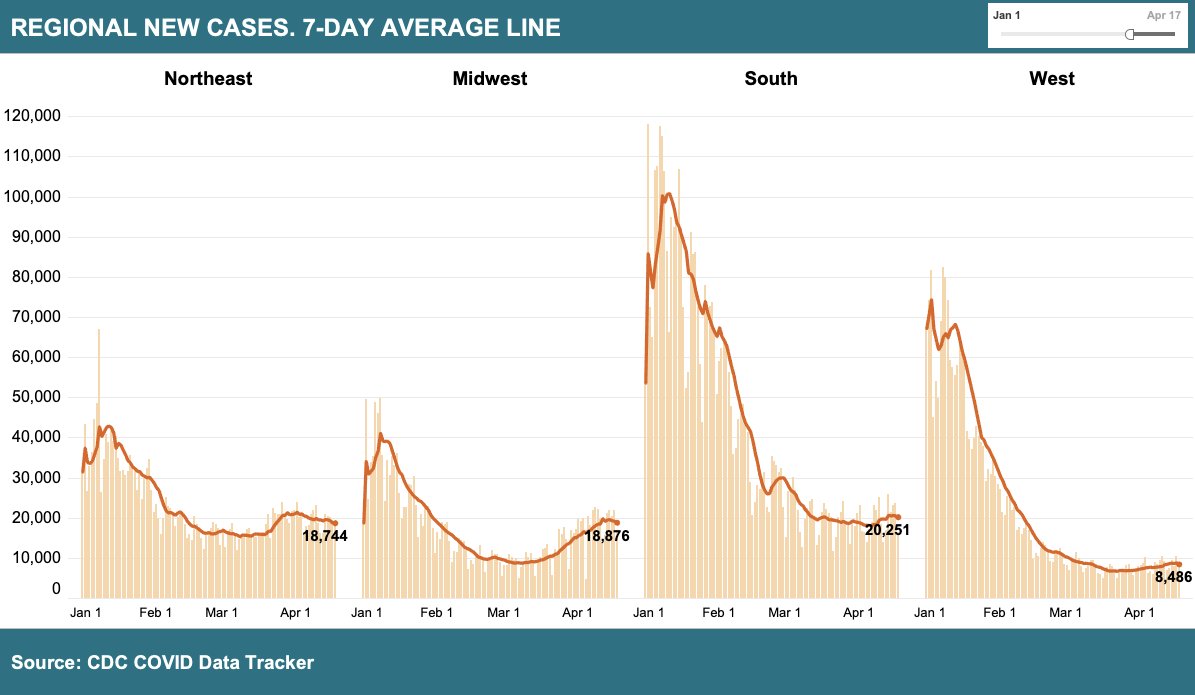
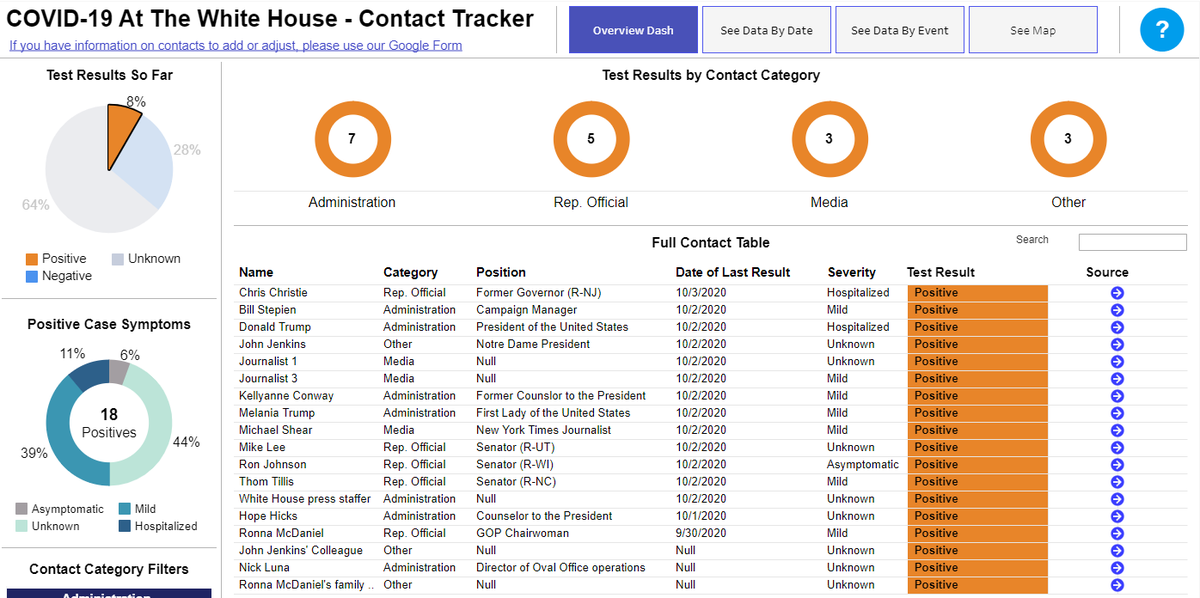
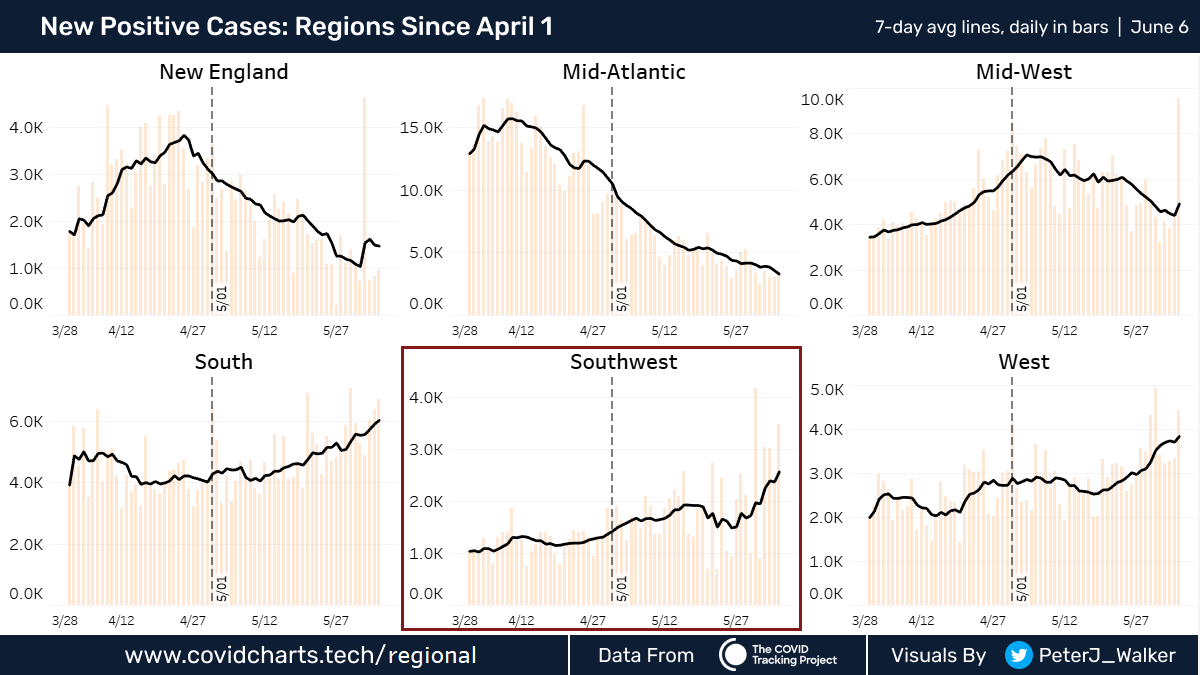
Insights from the @COVID19Tracking numbers today - there's a rising worry in the Southwest.

Cases started jumping up around 5/26 and haven't stopped growing. The % positive is also rising, so increased testing doesn't explain the jump.

Which states are spiking? 1/
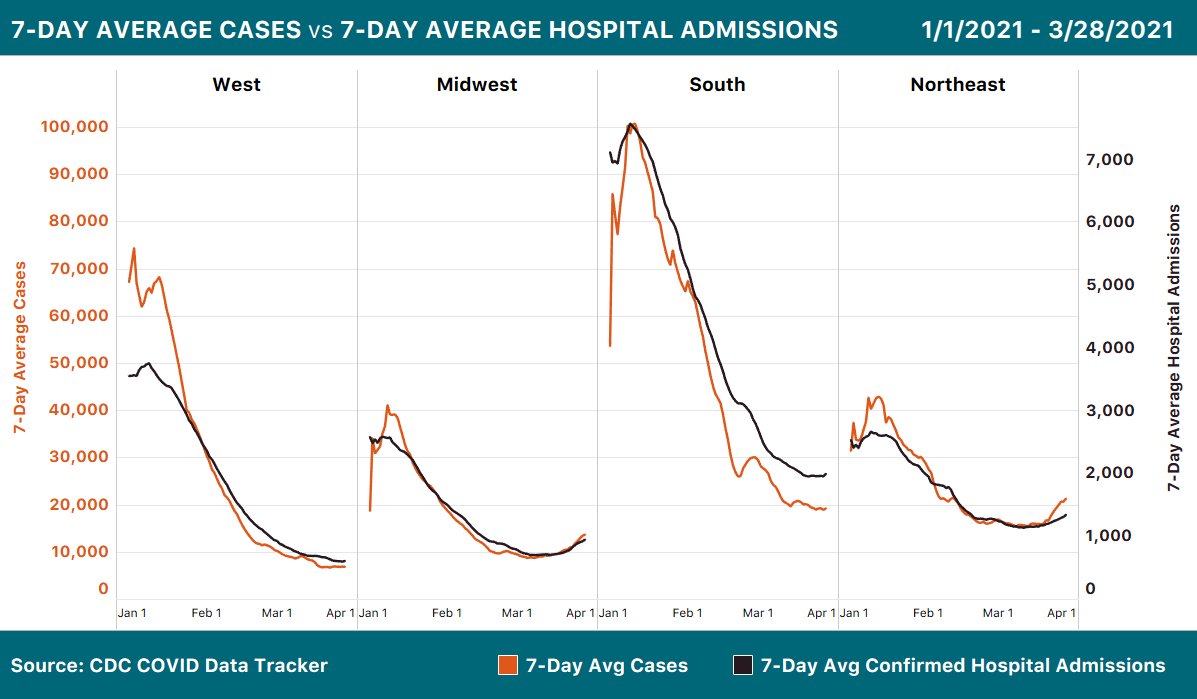
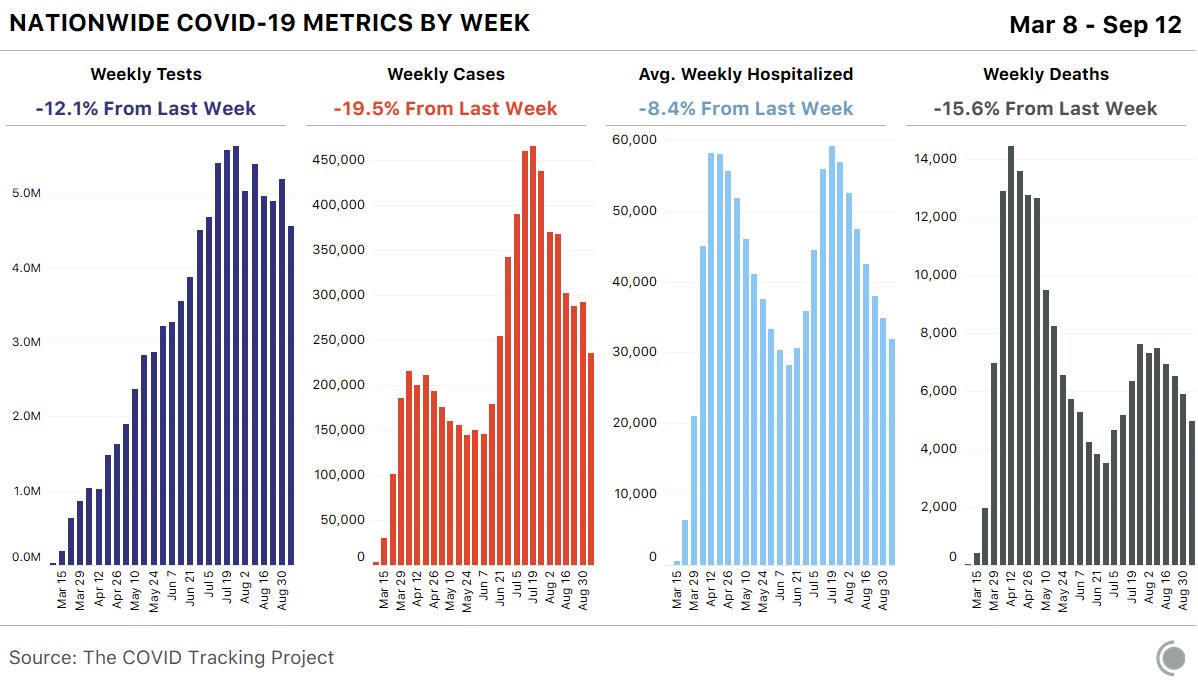
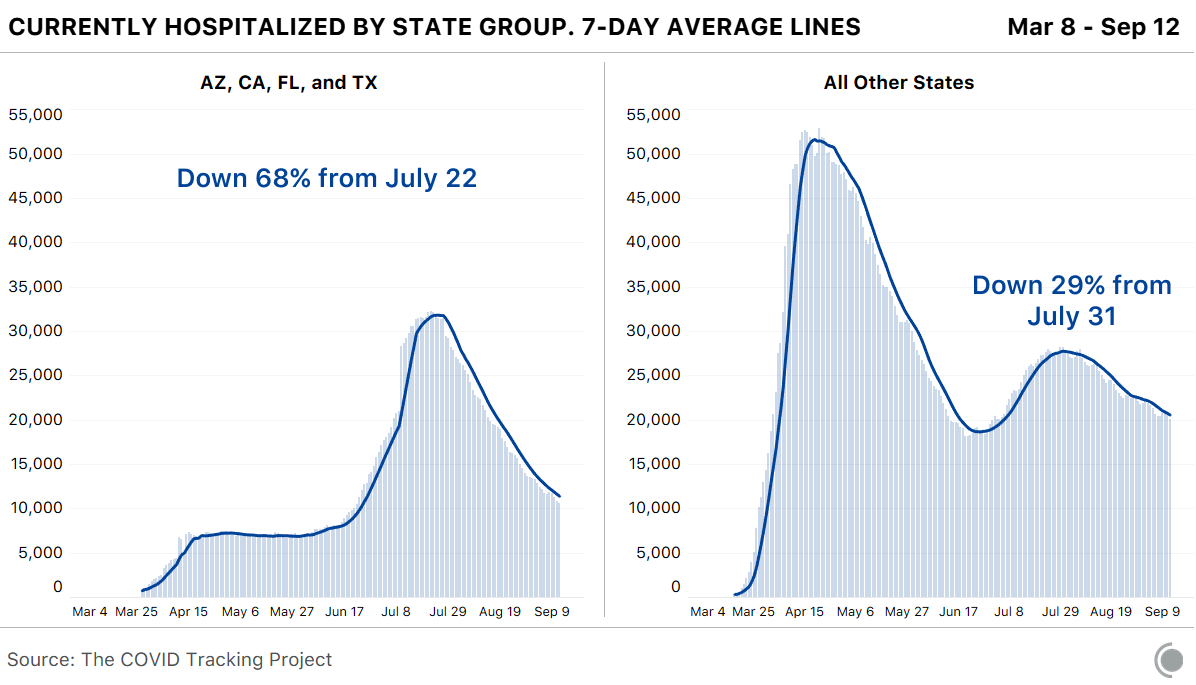
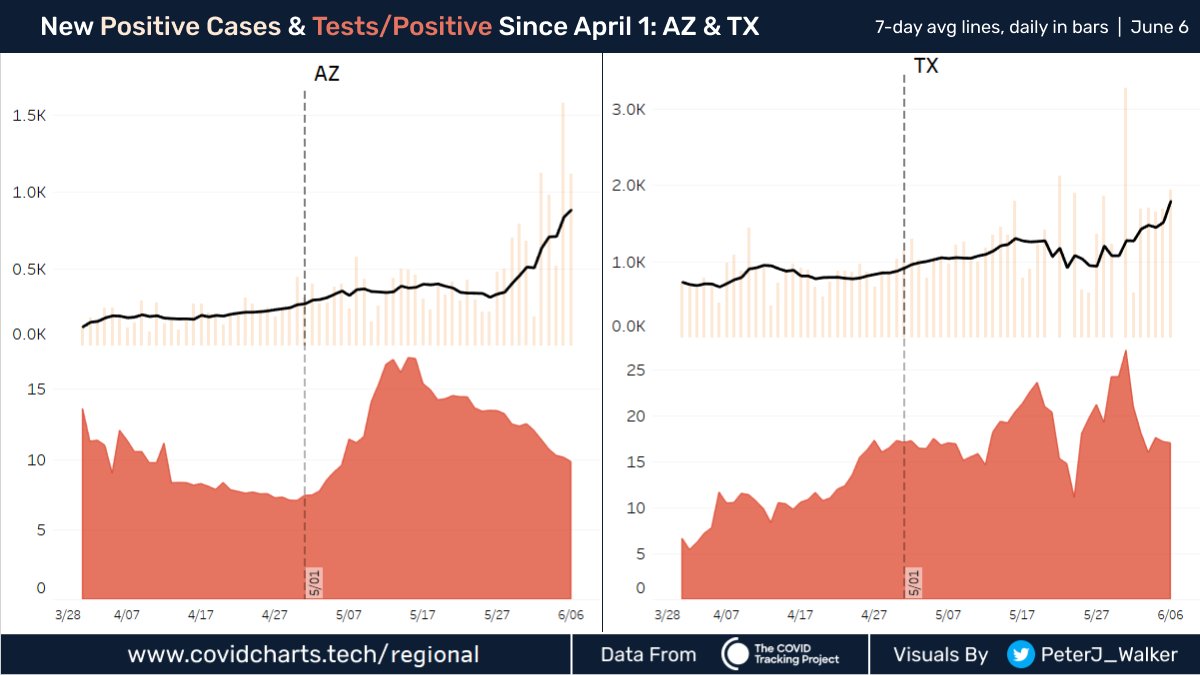
Arizona & Texas - #COVID hotspots. Both seeing:

- case growth⬆️
- % positive⬆️(AZ over 10% positive this week)
- Currently hospitalized⬆️(highest ever in AZ today)
- 7-day trend in deaths⬆️

Will officials consider scaling back re-opening? /2

@CarlBialik @Noahpinion @DemFromCT

• • •

Missing some Tweet in this thread? You can try to force a refresh
 

Keep Current with Peter Walker

Peter Walker Profile picture

Stay in touch and get notified when new unrolls are available from this author!

Read all threads

This Thread may be Removed Anytime!

PDF

Twitter may remove this content at anytime! Save it as PDF for later use!

Try unrolling a thread yourself!

how to unroll video
  1. Follow @ThreadReaderApp to mention us!

  2. From a Twitter thread mention us with a keyword "unroll"
@threadreaderapp unroll

Practice here first or read more on our help page!

More from @PeterJ_Walker

Apr 19, 2021
Optimistic COVID 🧵 - I think we may be rounding towards the mini summit of this final hump.

Cases by region here since Jan 1, 2021. Midwest seems to have turned for real, only real remaining worry is the South (but vaccinations continue to grow). 1/n
Michigan, the recent hotspot - is that a top? Maybe a touch early to say for sure, but certainly the exponential growth is no longer there. 2/n
Hospital admissions by region (7-day avg). Bump up in the South, starting to turn in the MW. 3/n
Read 6 tweets
Mar 29, 2021
Why @CDCDirector is leery of reopening across the country - brief 🧵 on current state of COVID metrics.

Nationally, cases are rising off of recent lows and that is matched by an uptick in hospital admissions (more of whom are younger, unvaccinated persons than before) 1/5
Clearly the case rise is happening in the Northeast and Midwest. 2/5
Regions with cases rising are also seeing hospital admissions follow suit, though more tightly correlated in the Midwest than NE. 3/5
Read 5 tweets
Dec 27, 2020
Little reminder🧵on the holiday effect in COVID data.

Major holidays have had significant effects on reported COVID data this year. Below you can see how COVID cases have responded to holidays with sharp declines in almost every instance. 1/
So why is that? A myriad of reasons. Some state don't report anything on a holiday, as their staff is given a well-deserved day off. People may be less likely to get a test on a holiday. Some states report a fraction of their known cases...it's messy. 2/
This reporting effect has dramatic impacts on known deaths as well. Given the extended lag between a COVID death and the public recognition of said death (anywhere from 7 days to 3 weeks), this will be a strange few weeks with both Xmas and NYE lag coming into play. 3/
Read 5 tweets
Oct 4, 2020
Final update 🧵 for the evening. Reminder that the initial tweet from the President was at 9:54pm PT on Thursday.

Since then, we've added 216 contacts to our tracker. 18 positive, 60 negative, 128 unknown.

Here's a breakdown of the positive cases thus far 1/n
When viewed on an event basis, the SCOTUS Rose Garden is the most impactful. 47 contacts so far and there are many more unknowns.

We'd like to include all possible contacts - staff, essential workers, etc deserve the same level of concern here 2/n
Here's a short gif of some of the options in the dashboard - lots of ways to dig into the data.

All of it is sourced (just click the arrows on any table to read the news article / tweet).

We'll keep looking - thx for your help, twitter!

@JesseOSheaMD @bhrenton @chrislhayes
Read 4 tweets
Sep 13, 2020
Rounding out another week of #COVID data - might be a good time to do a deeper dive into the numbers.

Optimistic 🧵 ahead...

First up - it was a good week. Holiday lag may have had some impact, but cases, hospitalizations, and deaths all fell from a week prior. 1/ Image
In our previous major hotspots, cases per million people have seen precipitous falls. Testing, while not at peak levels, has not fallen as much as cases (especially outside of Florida) 2/ Image
Currently hospitalized populations support the case declines. Down nearly 70% in the latest hotspots, and trending down more gently outside those 4 states. 3/

cc: @EricTopol, @DemFromCT Image
Read 8 tweets
Aug 7, 2020
Short thread on (what feels like continual) HHS
#COVID hospitalization issues.

Changeover to HHS happened 3+ weeks ago. So the data should be stable now, right?

Not even close. 1/
A select few states to illustrate the point. All numbers are currently hospitalized ppl per 100k population:

8/5 8/6
AR: 54 ?? (not even included)
FL: 46 31
TX: 34 15
AL: 41 8
SC: 30 3

They're all like that (see @JasonSalemi for full list) 2/
Ok, so why are they like that? Mostly because not all hospitals reported to HHS. But the % not reporting varies state by state, for a whole host of reasons.

More galling than the clearly faulty reporting system is the lack of communication. 3/
Read 4 tweets

Did Thread Reader help you today?

Support us! We are indie developers!


This site is made by just two indie developers on a laptop doing marketing, support and development! Read more about the story.

Become a Premium Member ($3/month or $30/year) and get exclusive features!

Become Premium

Don't want to be a Premium member but still want to support us?

Make a small donation by buying us coffee ($5) or help with server cost ($10)

Donate via Paypal

Or Donate anonymously using crypto!

Ethereum

0xfe58350B80634f60Fa6Dc149a72b4DFbc17D341E copy

Bitcoin

3ATGMxNzCUFzxpMCHL5sWSt4DVtS8UqXpi copy

Thank you for your support!

Follow Us on Twitter!

:(