(1) Yesterday, I noticed that the #COVID19 outbreak in Italy seemed to be contained to the Po river watershed.
Today, I thought I'd look at watersheds around NYC, to see if they could explain the large variations between outcomes within the city

Today, I thought I'd look at watersheds around NYC, to see if they could explain the large variations between outcomes within the city
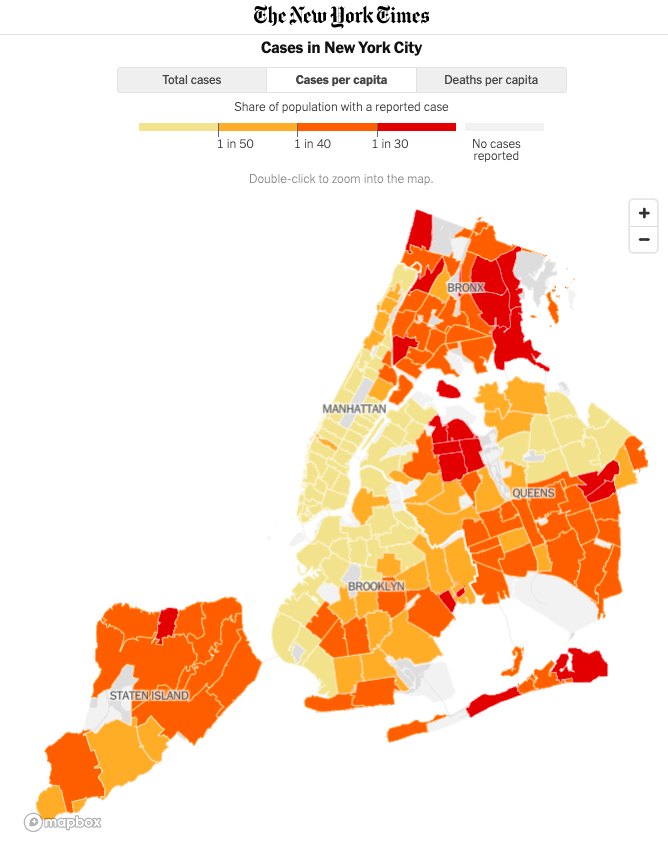
(2) Conventional wisdom has explained the stark variation in outcomes between boroughs as being affluence related, but is it?
Brooklyn & Queens are split geographically into high and low infection zones.
The Bronx is hit very hard, but it doesn't cross the Harlem river.
Brooklyn & Queens are split geographically into high and low infection zones.
The Bronx is hit very hard, but it doesn't cross the Harlem river.

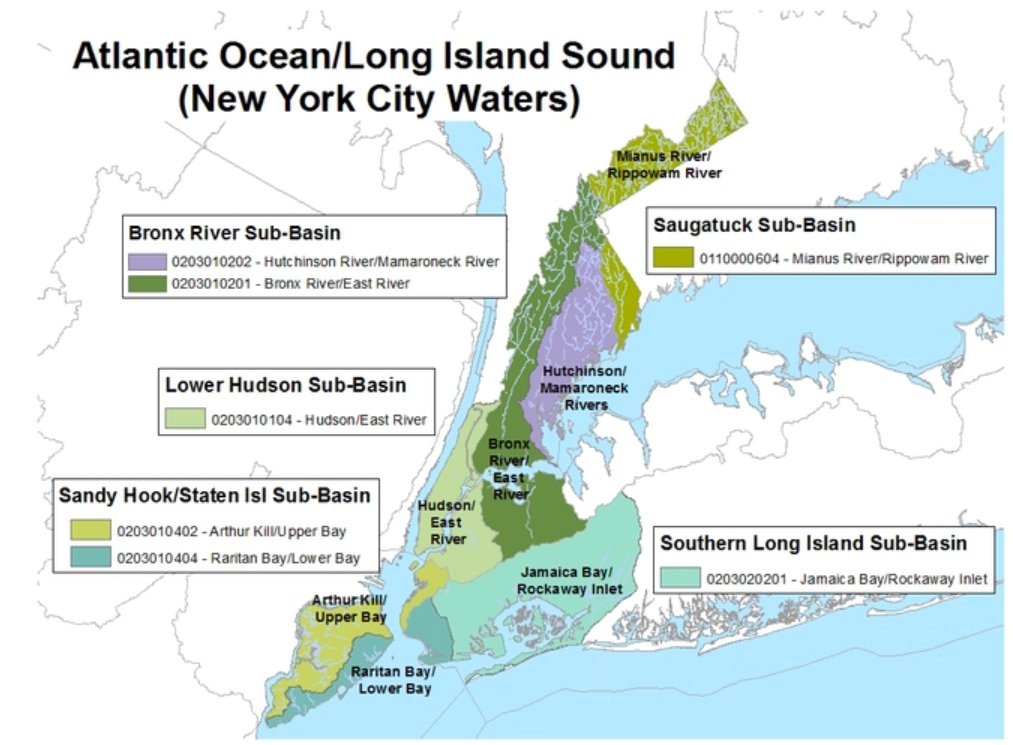
(3) This "watershed" map shows relationships between regions that may not be apparent to everyone. Manhattan and west Brooklyn share a watershed.
Could watersheds play a role in viral transmission?
Could watersheds play a role in viral transmission?

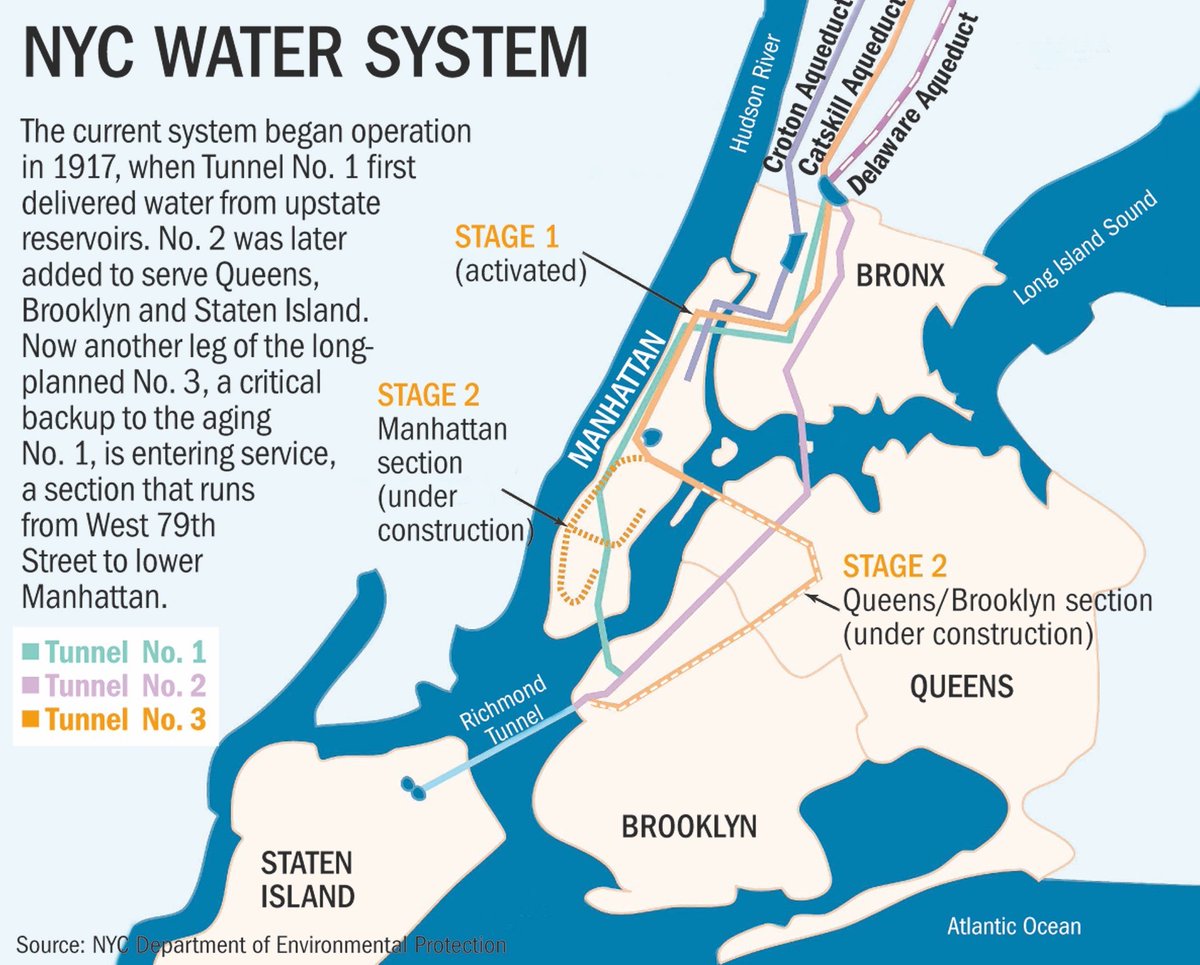
(4) All the boroughs receive fresh water through a set of tunnels coming from upstate. It's unlikely these are involved in viral transmission.
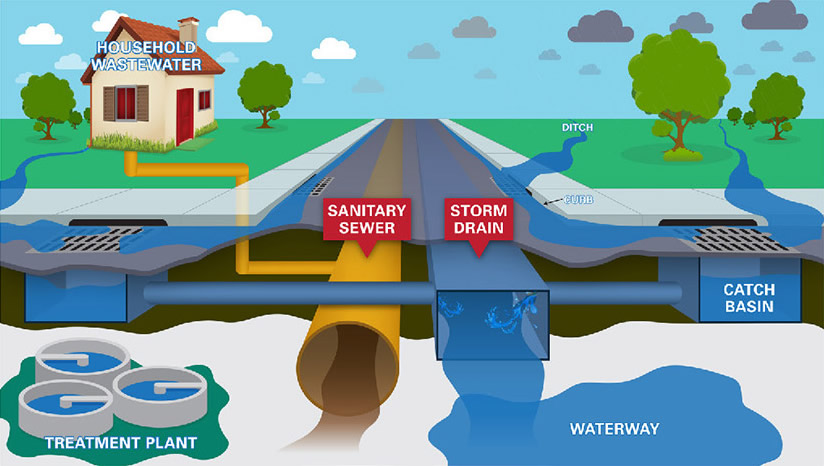
(5) Sewage and storm water systems are more likely to be a vector.

(6) Every city has a sewage, wastewater and stormwater system. New York City has a system on steroids.

(7) There is good correspondence between Water Pollution Control Plants 3, 5, 6, 9 and 13 and the areas of low infection rates in the city.


(8) In Italy, the outbreak was contained to the Po river watershed.
In Brooklyn and Queens, large areas had low infection rates despite being adjacent to large areas with high infection rates.
Could the sewer, wastewater and stormwater systems play a role in viral transmission?
In Brooklyn and Queens, large areas had low infection rates despite being adjacent to large areas with high infection rates.
Could the sewer, wastewater and stormwater systems play a role in viral transmission?
(10) PS: I just noticed something very interesting.
It looks like the #4 covers areas in the Bronx and on Manhattan, on both sides of the Harlem river, including its mouth.
This is the only region of significant infection on Manhattan Island.
It looks like the #4 covers areas in the Bronx and on Manhattan, on both sides of the Harlem river, including its mouth.
This is the only region of significant infection on Manhattan Island.

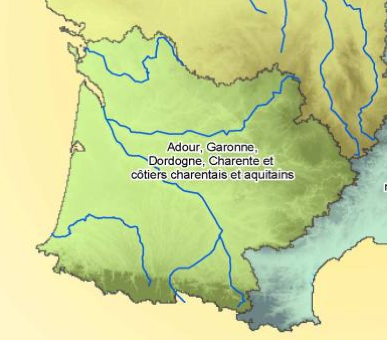
(11) In France, Map of Rivers (left) v. #COVID19 Deaths (right). The West Coast of France was largely spared as the highly connected river network region to the east and northeast of Paris was hard hit.
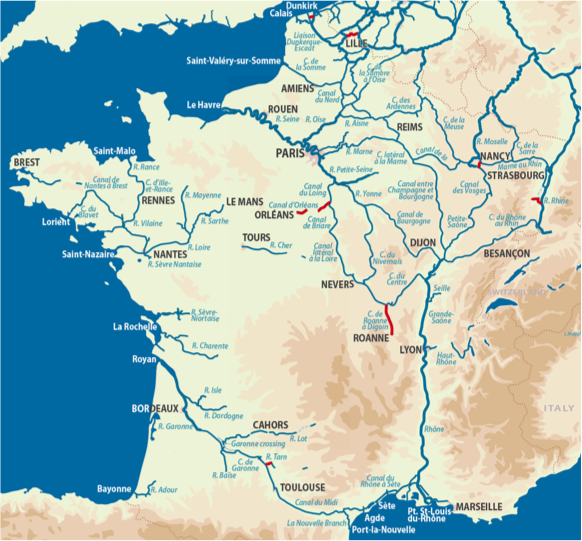
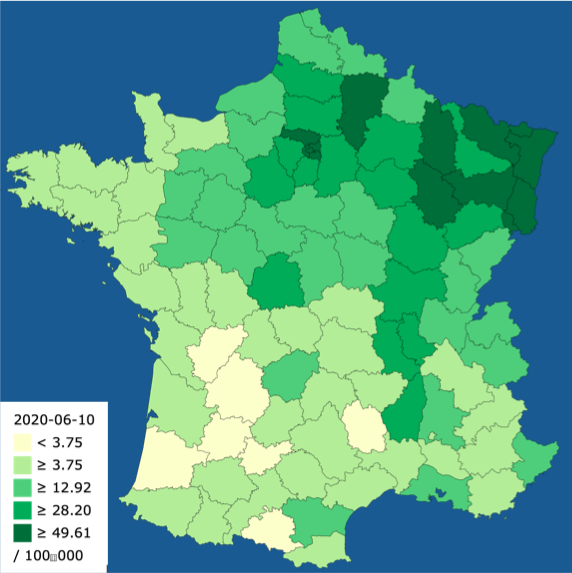
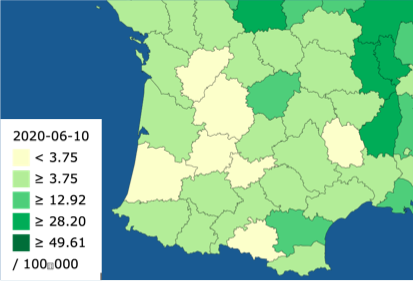
(12) Note that the watersheds in the southwest of France are independent of France's interior.


(13) An Abstract Color View of Western Europe's Watersheds from Space.
Note Northern Italy's Po river watershed in red, and France's Loire and Seine river watersheds in cyan and magenta.
Note Northern Italy's Po river watershed in red, and France's Loire and Seine river watersheds in cyan and magenta.

(14) United Kingdom cases tied to the Thames watershed, but that's just saying their clustered near London.

(15) Here's a recent article stating New Jersey has many communities that still have "combined sewage and storm water systems". These systems are being phased out over time to prevent sewage from flowing into nearby waterways.

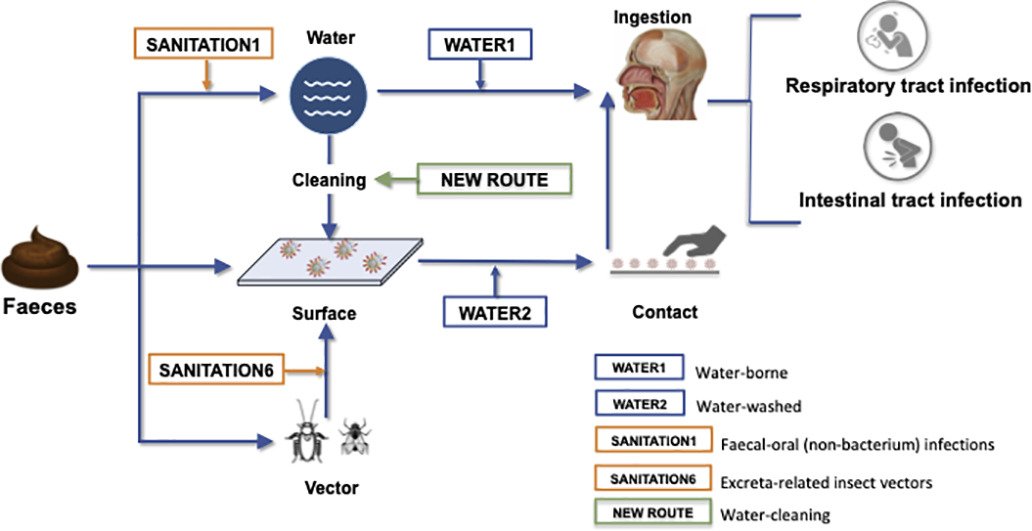
(16) We know sewage can contain coronavirus from human feces. Perhaps the water treatment areas that still have "combined sewage and stormwater" systems are at risk.
If this is so, we would expect contamination to rise with rain fall.
circleofblue.org/2020/world/vir…
If this is so, we would expect contamination to rise with rain fall.
circleofblue.org/2020/world/vir…
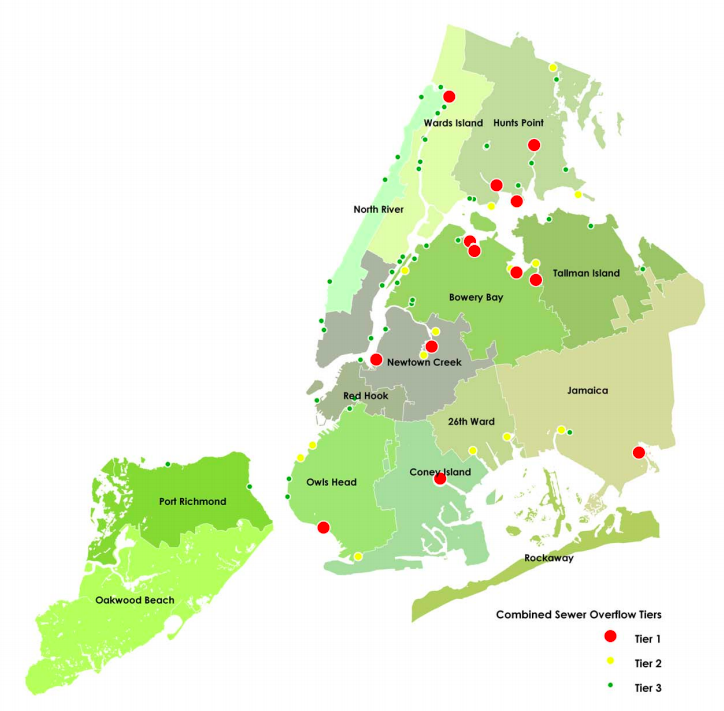
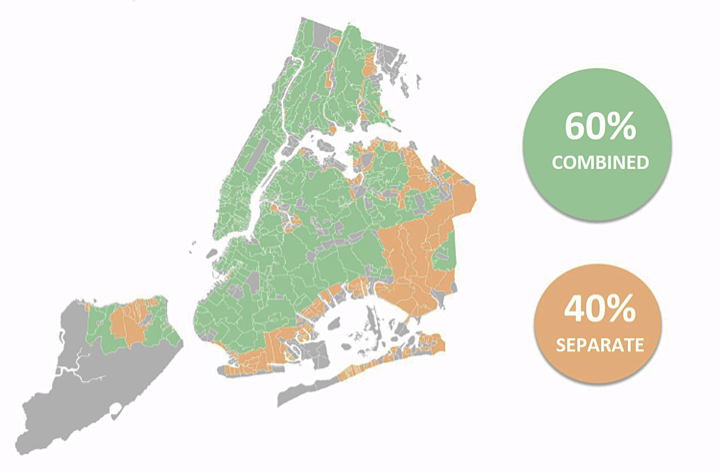
(17) This nyc.gov reference says 60% of NYC still has "combined sewer and stormwater" systems.
The map below shows the locations of the overflow tiers. The Harlem and East rivers figure prominently, but the Hudson is not spared.
www1.nyc.gov/site/dep/water…
The map below shows the locations of the overflow tiers. The Harlem and East rivers figure prominently, but the Hudson is not spared.
www1.nyc.gov/site/dep/water…
(18) Transmission from the sewer system may not involve the storm drains into the waterways. It could be sewage contamination due to toilet plumes, poor public restroom hygiene or leaks in the system.
(19) There were three rainstorms at Laguardia between 3/19 and 3/29. The first two were over an inch of accumulation. This undoubtedly led to some Combined Sewer Overflow (CSO) events.


(20) I found a great resource on this. It explains where the combined sewers are, and it's not where I thought. It seems to be updates since Hurricane Sandy.
storymaps.arcgis.com/stories/d4ac0c…
storymaps.arcgis.com/stories/d4ac0c…
(21) So during the outbreak, Combined Sewage Overflows occurred on three days. The primary drain locations are shown in red, the secondary are in yellow.

(22) The Tier 1 CSO drains might correspond with problems. It doesn't seem to explain Staten Island, but could explain Bowery Bay and the Harlem and Bronx river areas.


(23) This EPA map shows there are plenty of Combined Sewer Overflows on the North side of Staten Island and all over the Jersey side of the Hudson.

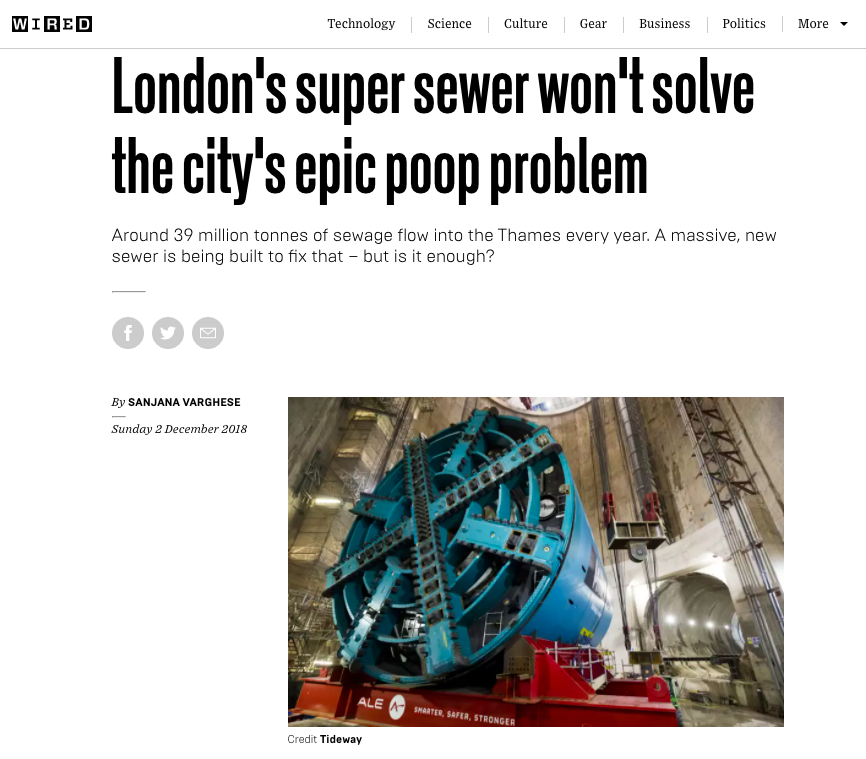
(24) It looks like Combined Sewer Overflows are a big problem near London, too.
wired.co.uk/article/sewage….
wired.co.uk/article/sewage….

(26) It turns out that Japan was eliminating their Combined Sewer System and replacing it with a Separated Sewer System in 2011.
recwet.t.u-tokyo.ac.jp/symposium/mate…
recwet.t.u-tokyo.ac.jp/symposium/mate…
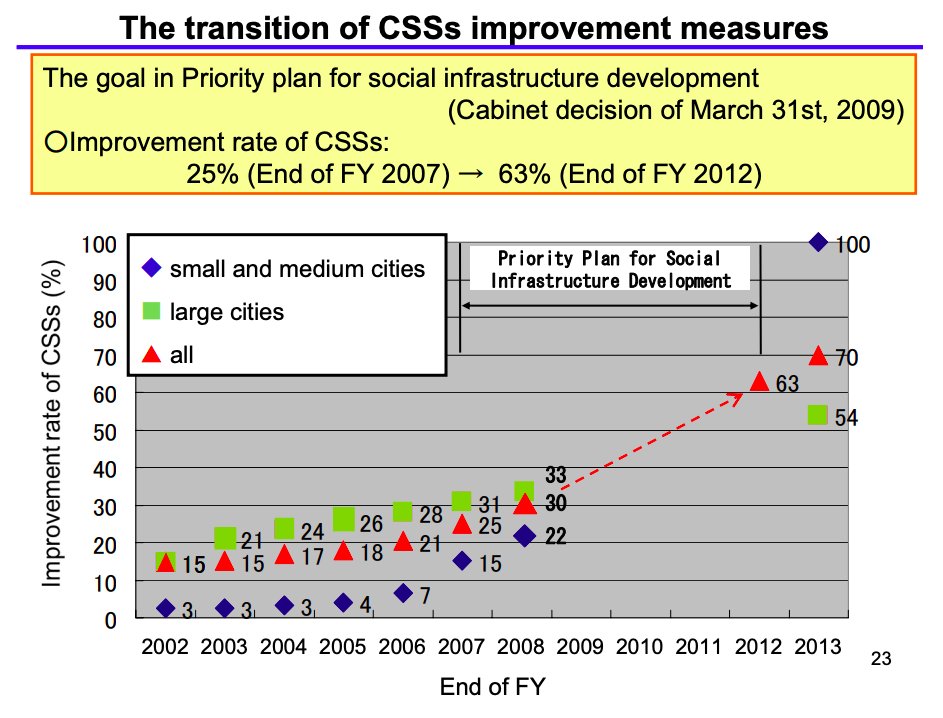
(27) At that time, Tokyo was 18% done with its conversion, but had a legal obligation to complete the transition by 2023.
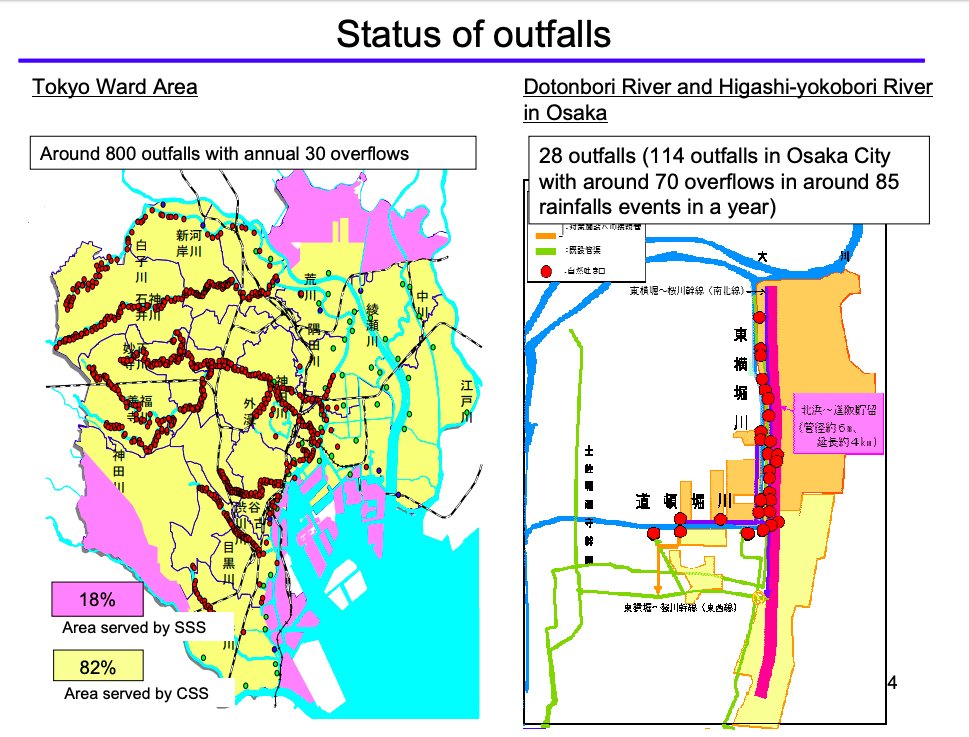
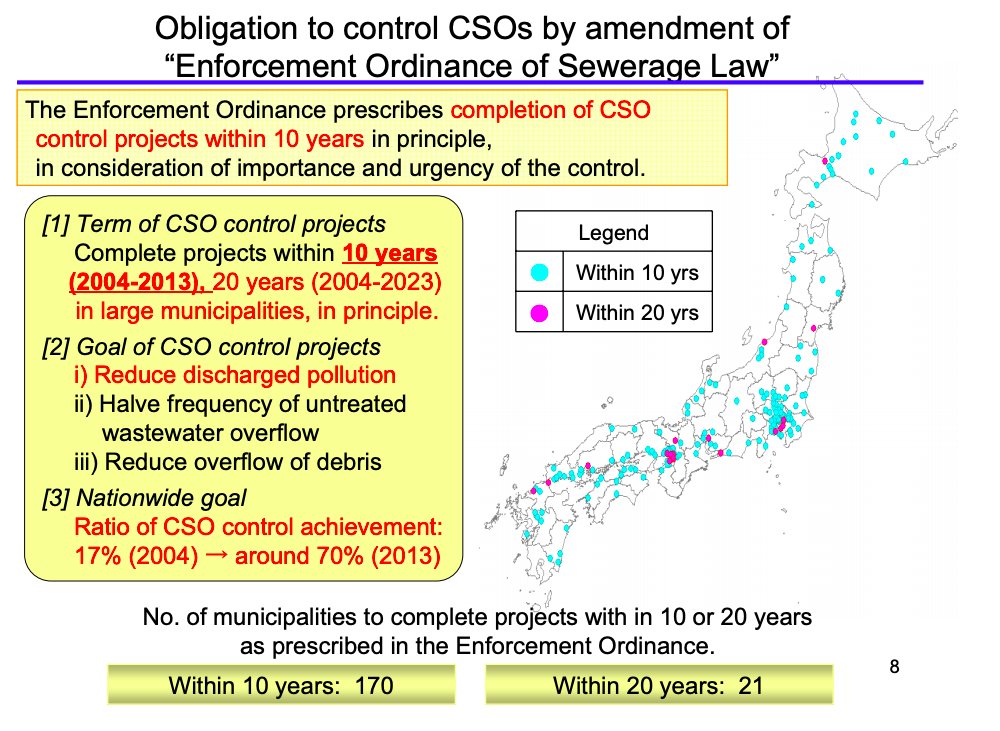
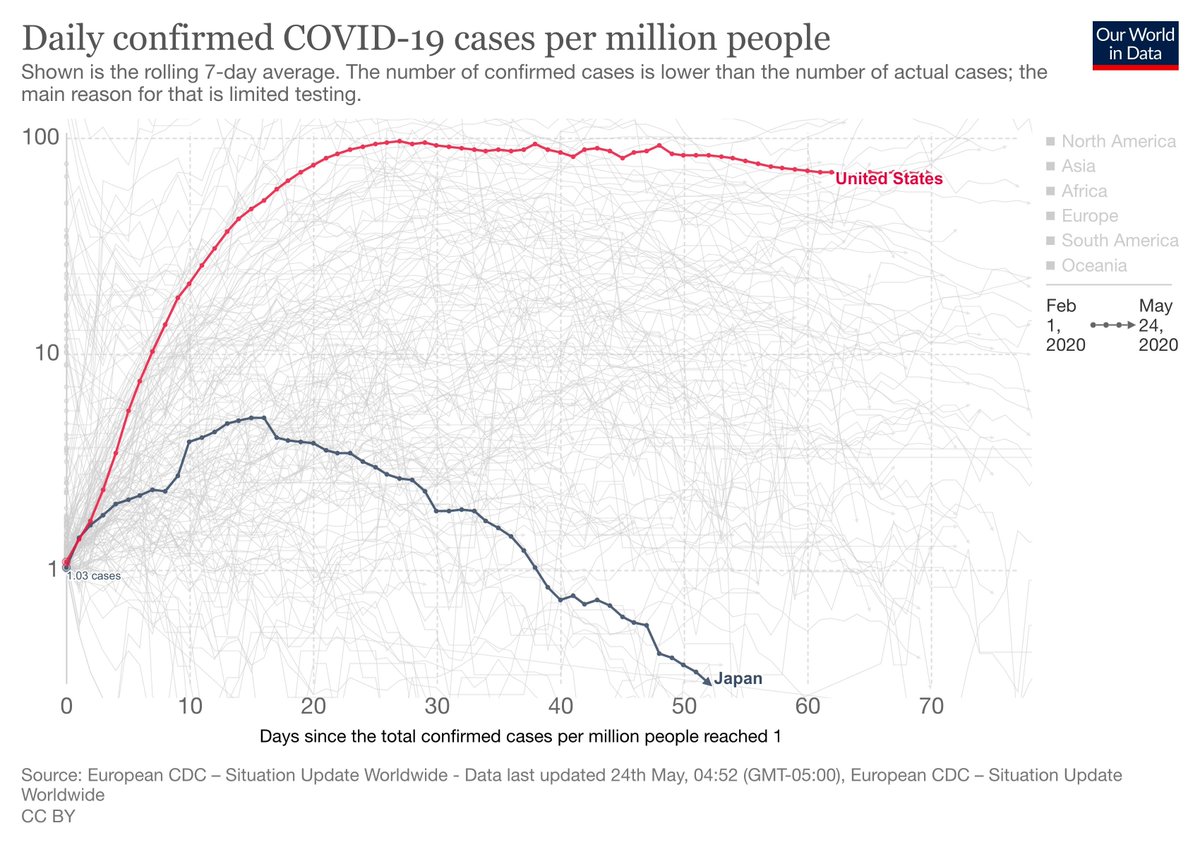
(28) Small and Medium cities were to complete the transition by 2013, and large cities were on target to complete 54% of the conversion by then.
Could this explain the Japanese success against coronavirus?
Could this explain the Japanese success against coronavirus?
(29) I know I've been all over the world map discussing this speculative idea, but it has born some fruit. I'm going to continue to research it.
At any rate, we took a look around the world's sewer and stormwater systems!
I hope you all have segregated systems, everywhere!
At any rate, we took a look around the world's sewer and stormwater systems!
I hope you all have segregated systems, everywhere!
(30) PPS: Milan soliciting approaches for upgrades to reduce its Combined Sewer Overflows (CSOs) as recently as 2018.
It appears Milan has a problem with CSOs, like New York and London. This could have contaminated the Po river with fecal coronavirus.
agroengineering.org/index.php/jae/…
It appears Milan has a problem with CSOs, like New York and London. This could have contaminated the Po river with fecal coronavirus.
agroengineering.org/index.php/jae/…
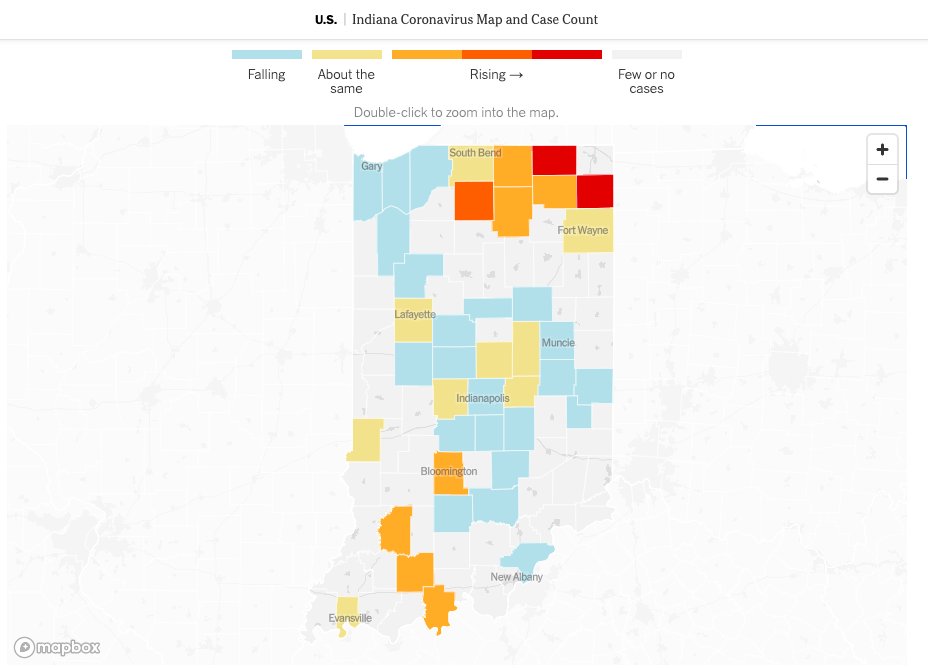
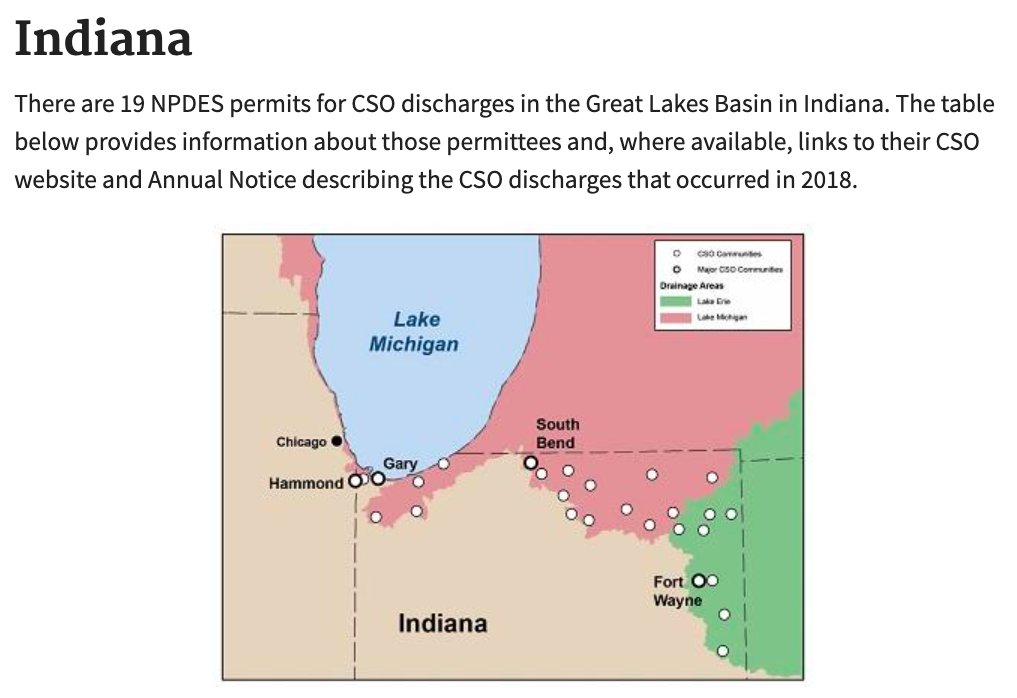
(31) Coronavirus Hot Spots in Indiana correspond with location of EPA approved Combined Sewer Overflow discharges.
epa.gov/npdes/combined…
epa.gov/npdes/combined…
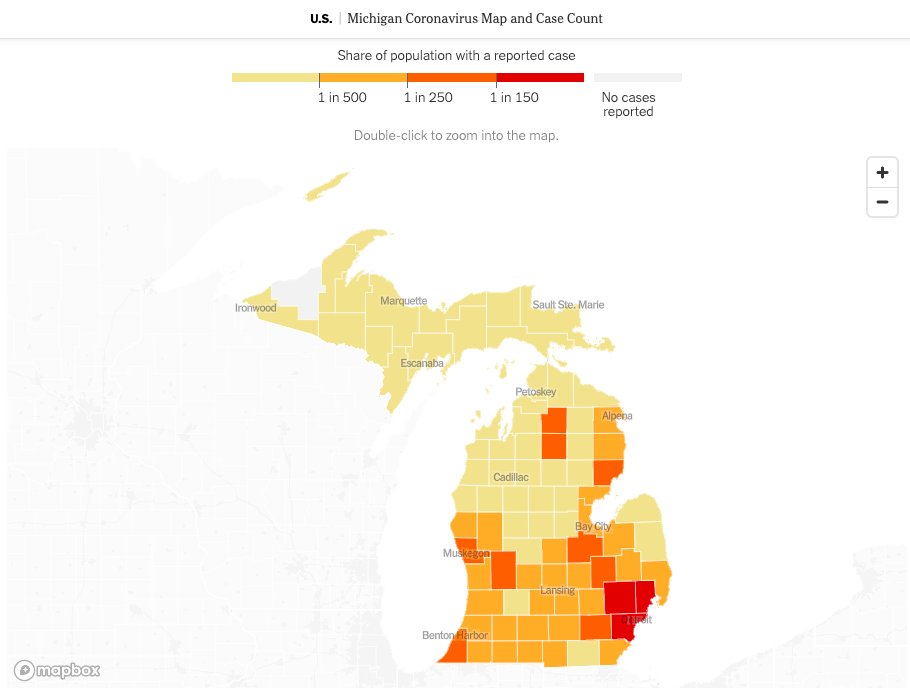
(32) Coronavirus per capita cases map corresponds with with many of Michigan's EPA permitted CSO discharge locations.

(33) Buffalo and Rochester lead Upstate New York in coronavirus cases. They also have EPA permitted CSO discharges.


(34) The EPA only listed permits for CSO discharges into the Great Lakes watershed. These are by no means the only CSO discharges in the United States.
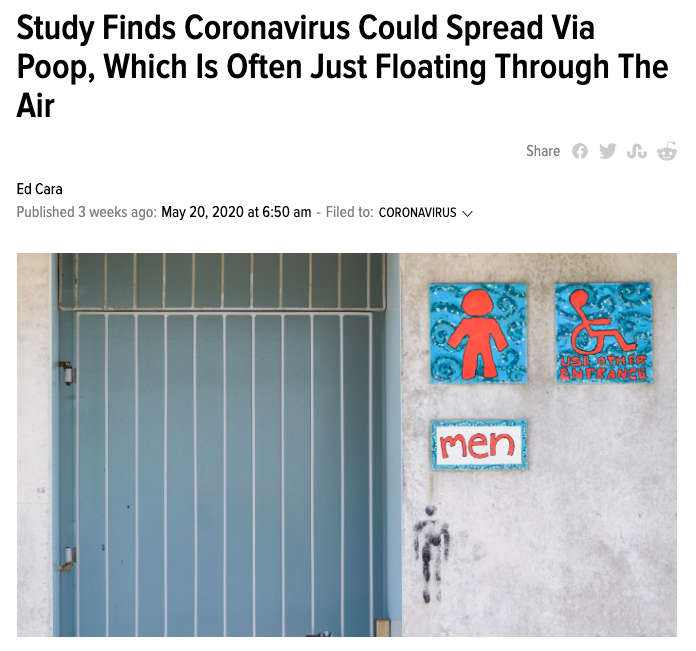
(35) The findings indicate “that infectious virus in faeces is a common manifestation of COVID-19,” they [the researchers] wrote.
gizmodo.com.au/2020/05/study-…
gizmodo.com.au/2020/05/study-…
(36) Estimating how much coronavirus infested sewage was poured out into NYC's rivers the in March 2020 after St. Patrick's day:
2.8 inches rainfall
45 inches annual rainfall; 20 billion gallons CSO
That's 1.2 billion gallons of coronavirus contaminated sewer overflow. Yuck.
2.8 inches rainfall
45 inches annual rainfall; 20 billion gallons CSO
That's 1.2 billion gallons of coronavirus contaminated sewer overflow. Yuck.


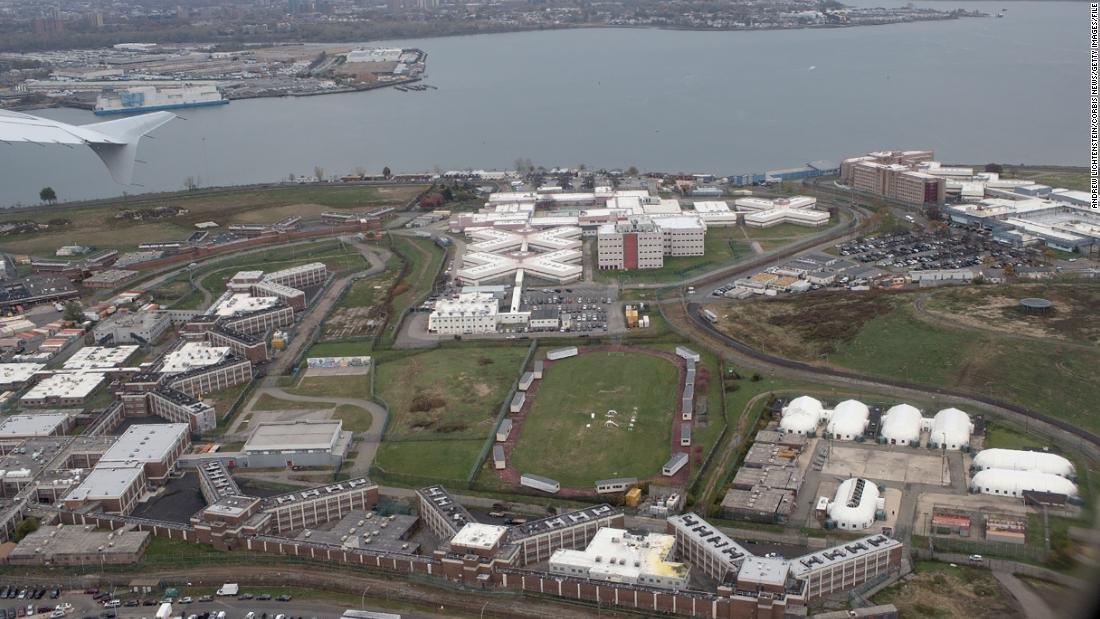
(37) There's a hot spot just south of Riker's Island.
As we look closer we find its Long Beach Township.
Just north, near the park, is a Combined Sewer Overflow discharge estimated to release 527 million gallons per year. Its weir is breached at 0.15 inches daily rainfall.
As we look closer we find its Long Beach Township.
Just north, near the park, is a Combined Sewer Overflow discharge estimated to release 527 million gallons per year. Its weir is breached at 0.15 inches daily rainfall.


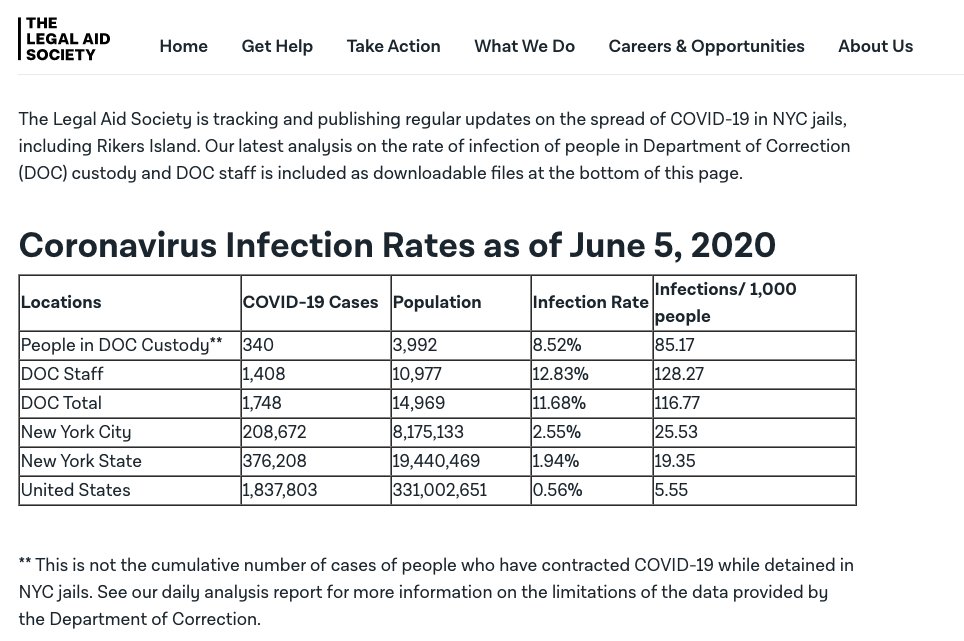
(38) It's rumored conditions were not favorable at Riker's Island either. The legal aid society estimates that it was 4.5X more likely that DOC inmates and staff would be infected by coronavirus than an average New Yorker.
legalaidnyc.org/covid-19-infec…
legalaidnyc.org/covid-19-infec…