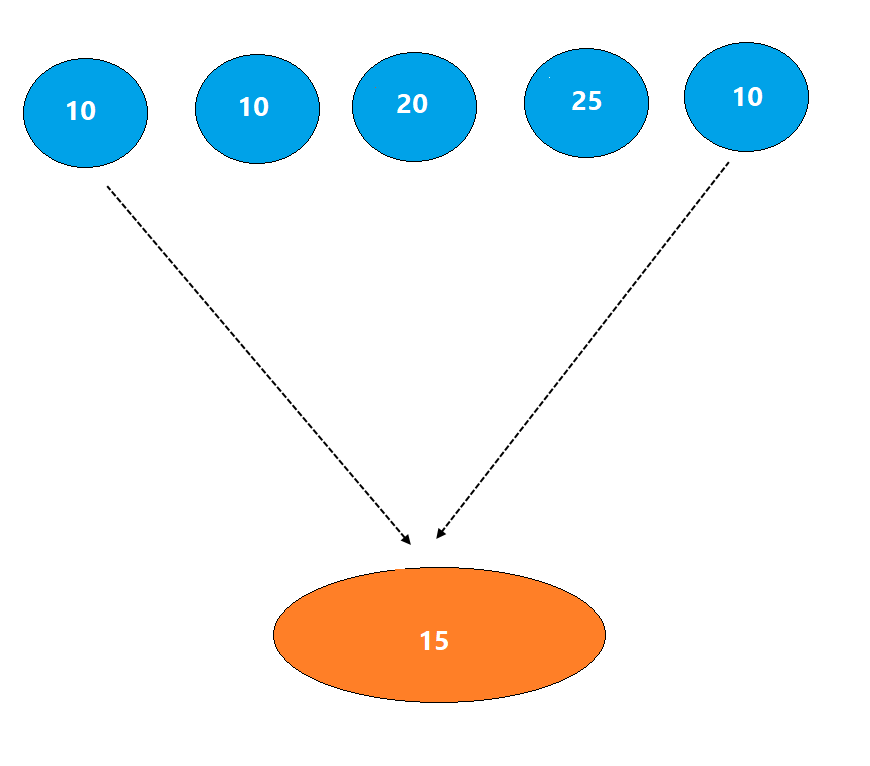
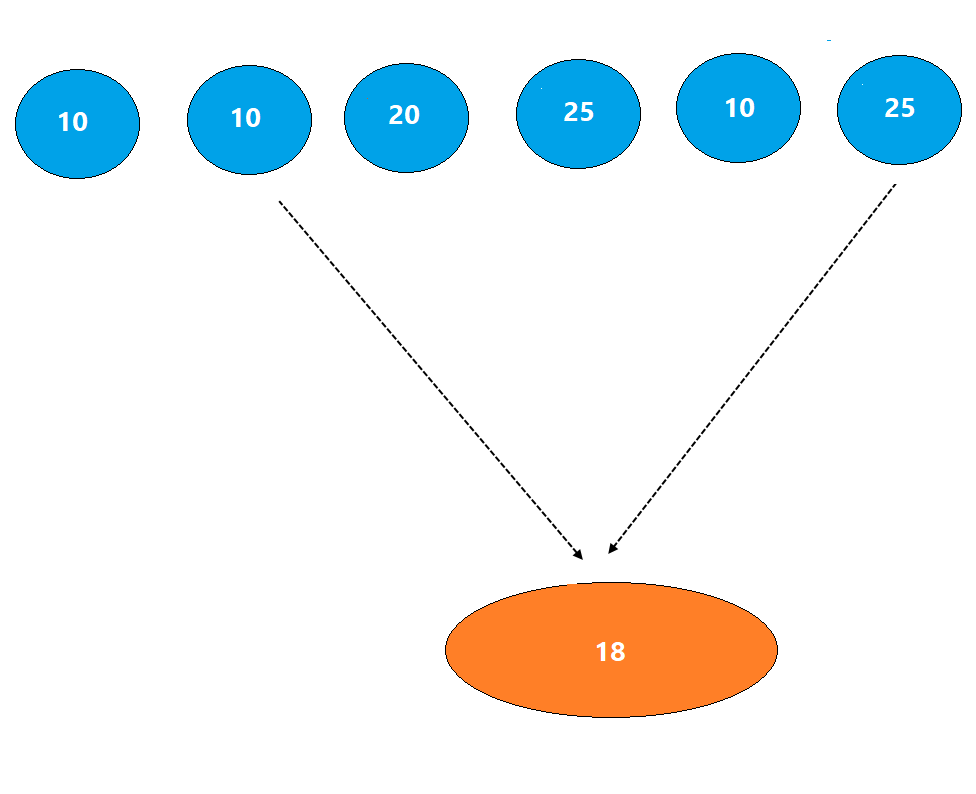
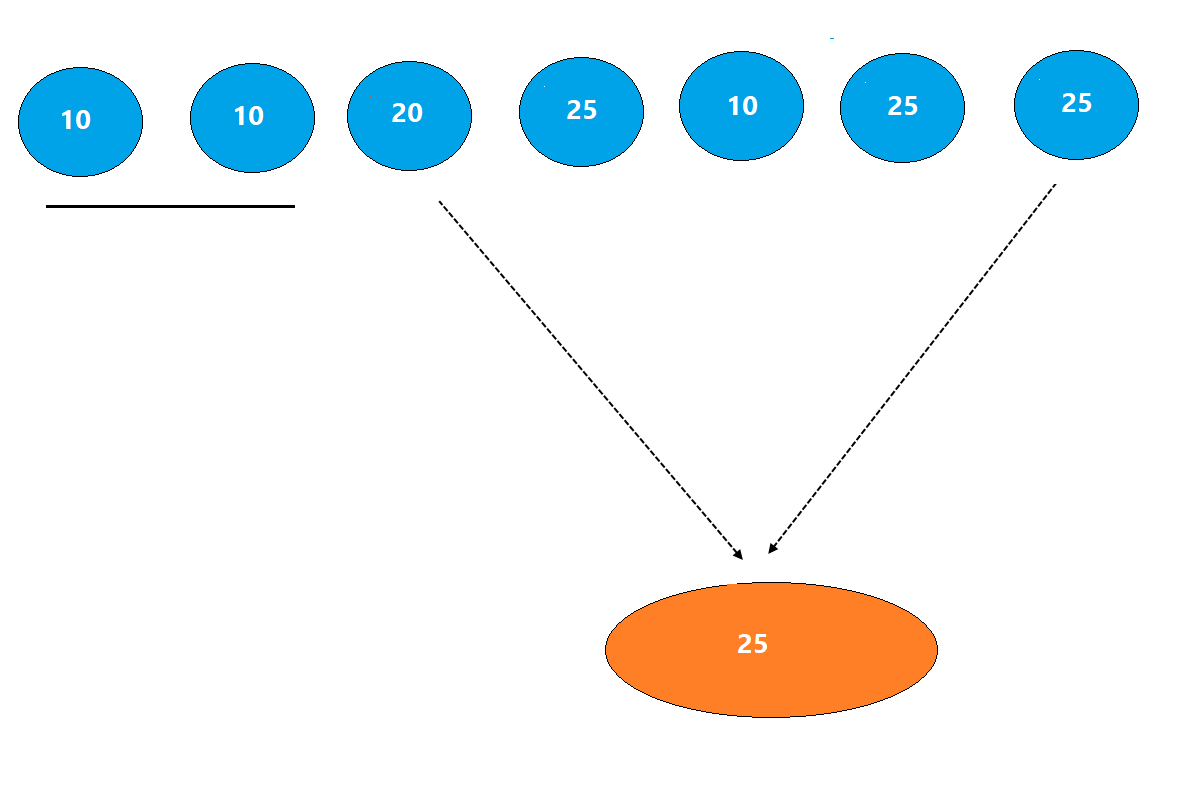
If so, let us discuss an interesting concept based on Supertrend indicator. Before that let us deconstruct the popular moving average indicator.
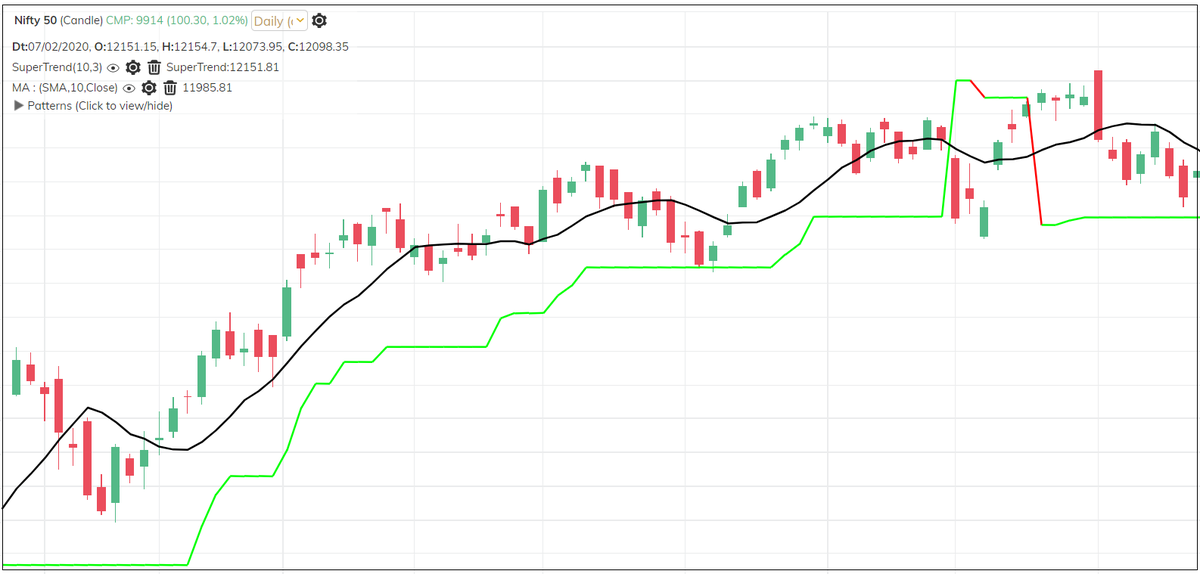
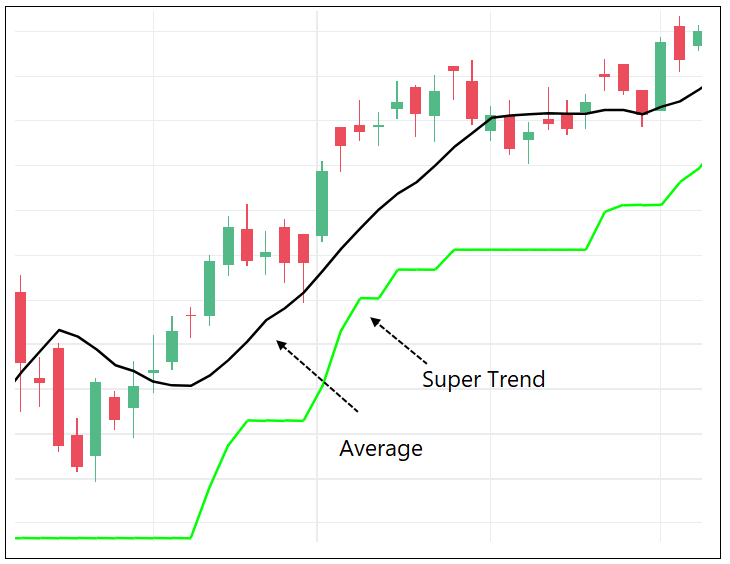
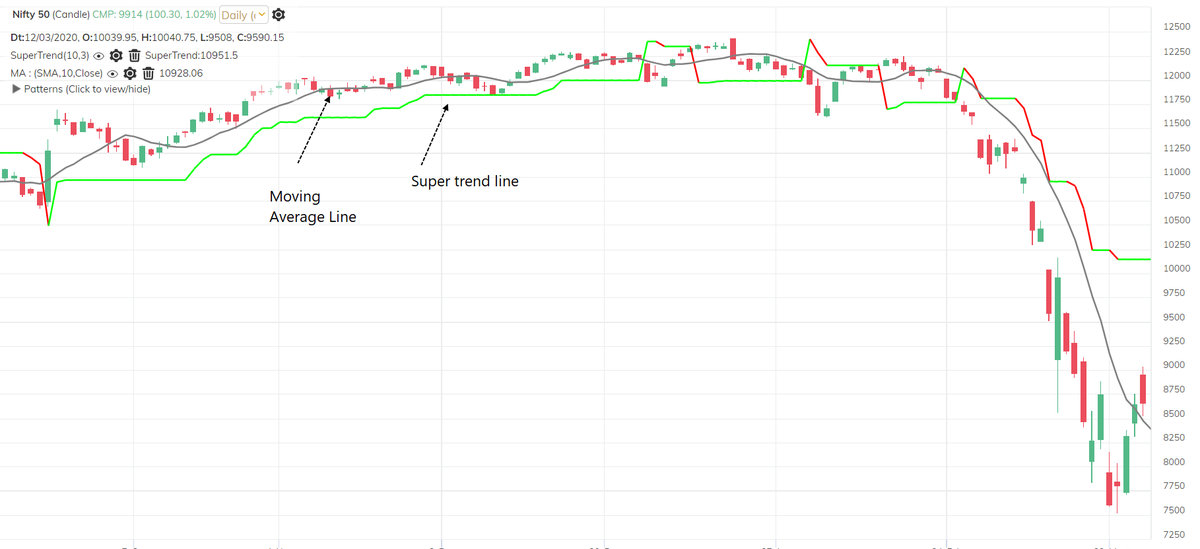
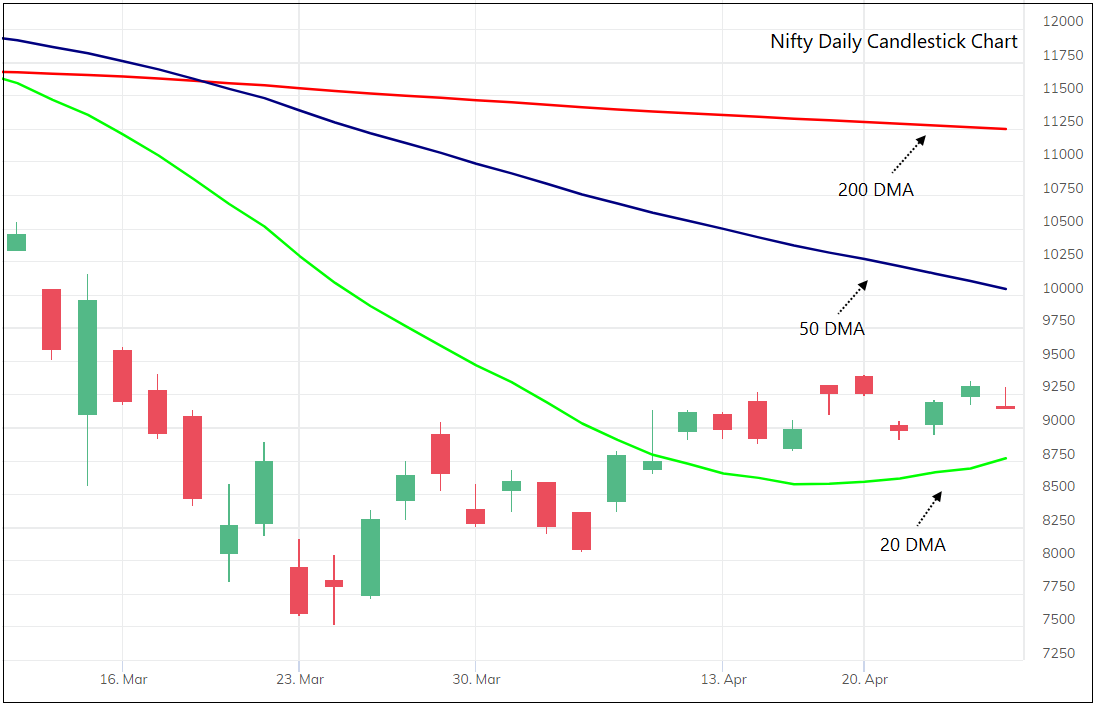
Moving average plots average of price while the supertrend is a volatility based average line.
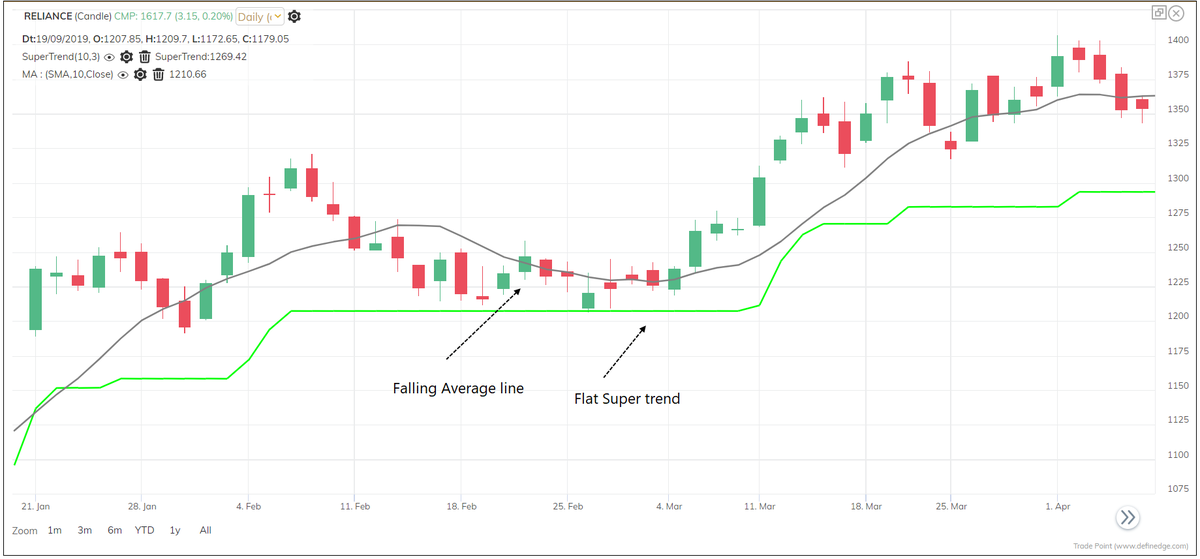
When the price is trading below moving average, but above the super trend, it is highly likely that the super trend will be flat in that scenario.
Why?
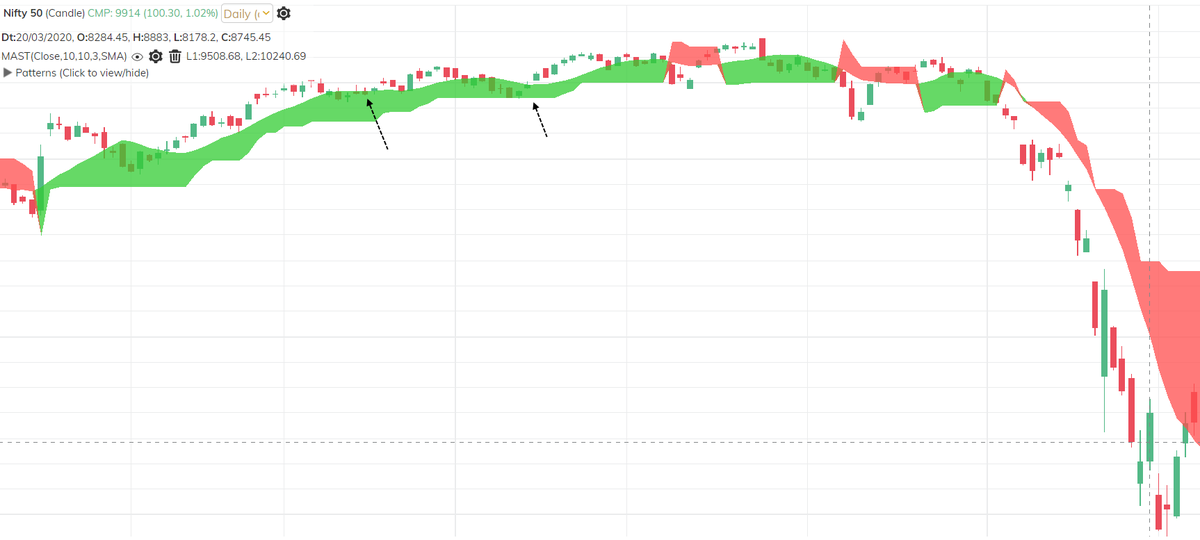
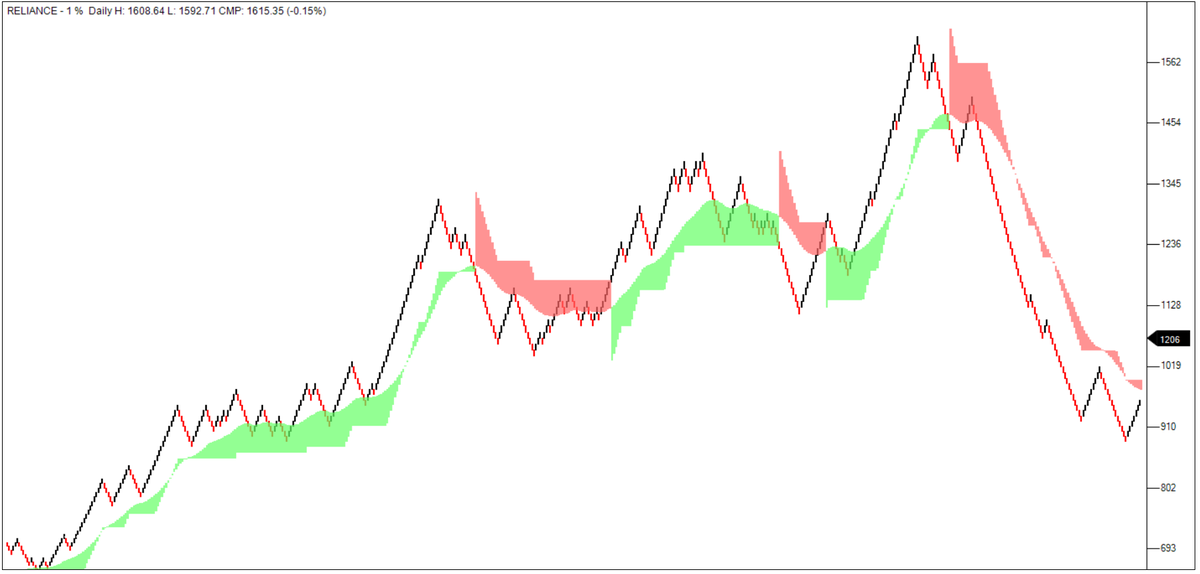
When the price is above the MAST band, look for bullish continuation price patterns
When the price is within the green band, look for bullish reversal patterns
When the price is within the red band, then look for bearish reversal patterns

