Chande Momentum Oscillator (CMO): Scanner
Dear Friends,
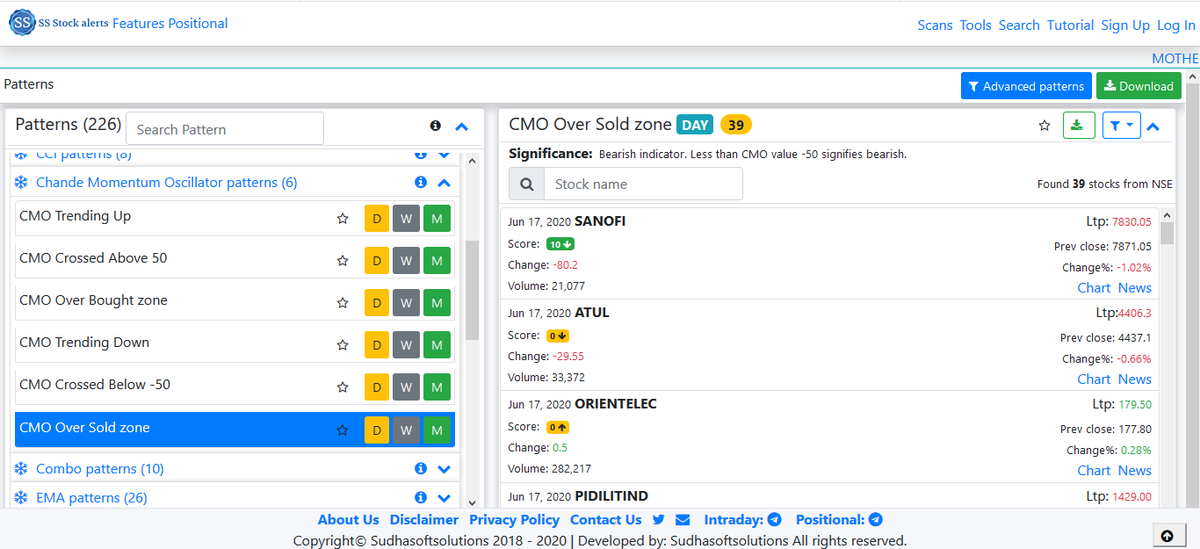
One of the user asked us to add scanner based on the CMO. Added below patterns to the site.
1. CMO Trending Up: CMO has crossed 0 from below is bullish.
2. CMO Crossed Above 50: CMO has crossed 50 from below is bullish.
Dear Friends,
One of the user asked us to add scanner based on the CMO. Added below patterns to the site.
1. CMO Trending Up: CMO has crossed 0 from below is bullish.
2. CMO Crossed Above 50: CMO has crossed 50 from below is bullish.

Scanner:-
3. CMO Over Bought zone: Bullish indicator. Greater than CMO value 50 signifies bullish.
4. CMO Trending Down: CMO has crossed 0 from above indicating bearish.
5. CMO Crossed Below -50: CMO has crossed -50 from above indicating bearish.
6. CMO Over Sold zone: Bearish.
3. CMO Over Bought zone: Bullish indicator. Greater than CMO value 50 signifies bullish.
4. CMO Trending Down: CMO has crossed 0 from above indicating bearish.
5. CMO Crossed Below -50: CMO has crossed -50 from above indicating bearish.
6. CMO Over Sold zone: Bearish.

Chande Momentum Oscillator: Thread
You will see a line between +100 to -100, that forms part of the Chande Momentum Oscillator, appearing in the lower pane in the chart below. Let us understand them.
You will see a line between +100 to -100, that forms part of the Chande Momentum Oscillator, appearing in the lower pane in the chart below. Let us understand them.

Before we understand the CMO, it is important to sort out a few concepts.
It works based on the close price. see below image for close price.
It works based on the close price. see below image for close price.

Calculation
1. Calculate the sum of higher closes over 9 periods.
if(todayClose > previousClose){
//Add up price
periodHigh = periodHigh + todayClose - previousClose;
}
1. Calculate the sum of higher closes over 9 periods.
if(todayClose > previousClose){
//Add up price
periodHigh = periodHigh + todayClose - previousClose;
}
2. Calculate the sum of lower closes over 9 periods.
if(todayClose < previousClose){
periodLow = periodLow + (previousClose - todayClose);
}
3. Subtract the sum gains over 9 periods from the sum of loss over 9 periods.
9 days differnce = periodHigh - periodLow
if(todayClose < previousClose){
periodLow = periodLow + (previousClose - todayClose);
}
3. Subtract the sum gains over 9 periods from the sum of loss over 9 periods.
9 days differnce = periodHigh - periodLow
4. Add the sum of lower closes over 9 periods to the sum of higher closes over 9 periods.
9 days total price movement = periodHigh + periodLow
9 days total price movement = periodHigh + periodLow
5. Divide 9 days differnce by 9 days total price movement and multiply by 100.
CMO = (9 days differnce(periodHigh - periodLow)/ 9 days total price movement (periodHigh + periodLow))*100
CMO = (9 days differnce(periodHigh - periodLow)/ 9 days total price movement (periodHigh + periodLow))*100
This is how CMO is calculated. It captures the strength of the trend that is in control.
How to know what is the trend?
The oscillator's value denotes the strength or weakness of the expected trend.
If cmo value 40 is it has good trend strength than cmo 20
How to know what is the trend?
The oscillator's value denotes the strength or weakness of the expected trend.
If cmo value 40 is it has good trend strength than cmo 20
The oscillator can be used as a confirmation signal when it crosses above or below the 0 line.
scanners:-
CMO Trending Up: CMO has crossed 0 from below indicating bullish.
CMO Trending Down: CMO has crossed 0 from above indicating bearish.
scanners:-
CMO Trending Up: CMO has crossed 0 from below indicating bullish.
CMO Trending Down: CMO has crossed 0 from above indicating bearish.
For example, if the 50-day moving average crosses above the 200-day moving average (golden cross), a buy signal is confirmed when the Chande momentum oscillator crosses above 0 , predicting prices are headed higher.
Traders can use the Chande momentum oscillator to spot positive and negative price divergence between the indicator and underlying security.
A negative divergence occurs if the underlying security is trending upward and Chande momentum oscillator is moving downwards.

A negative divergence occurs if the underlying security is trending upward and Chande momentum oscillator is moving downwards.


• • •
Missing some Tweet in this thread? You can try to
force a refresh


