
Engineer, Positional trader, Passionate developer.
Telegram: https://t.co/uvD99UGqne
FB: https://t.co/YJEJjxFL1M
YT: https://t.co/7TAWVH4Wdn

 3. Target can be 2% or 3% or 4%
 The scanner is available in the
 Now open the chart of #BLUESTARCO,

 What it means?
 2. Price and volume falling

 Exit rules:


 Scanner:-
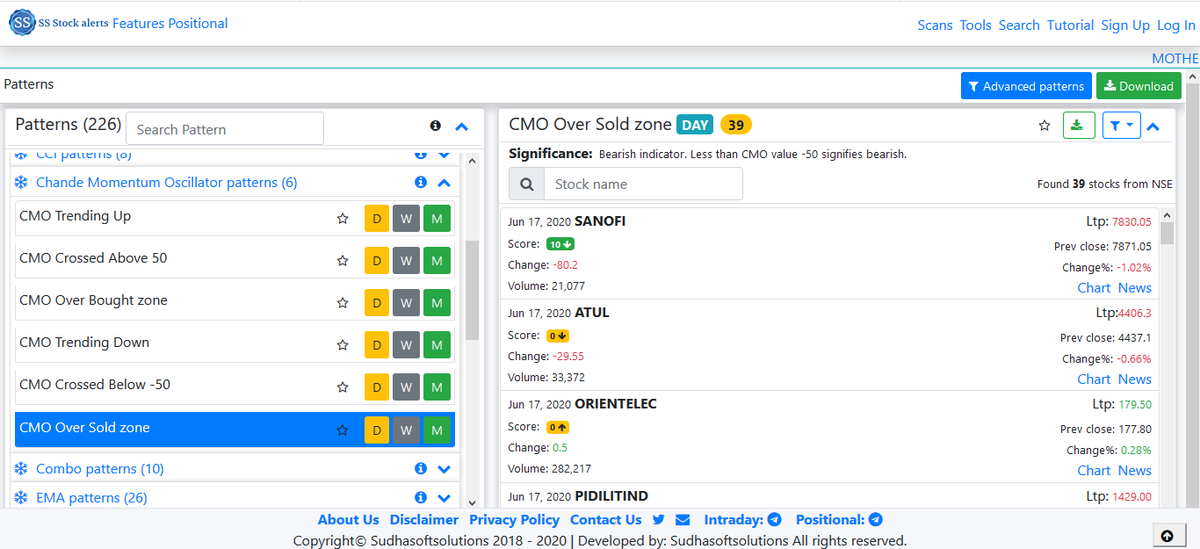
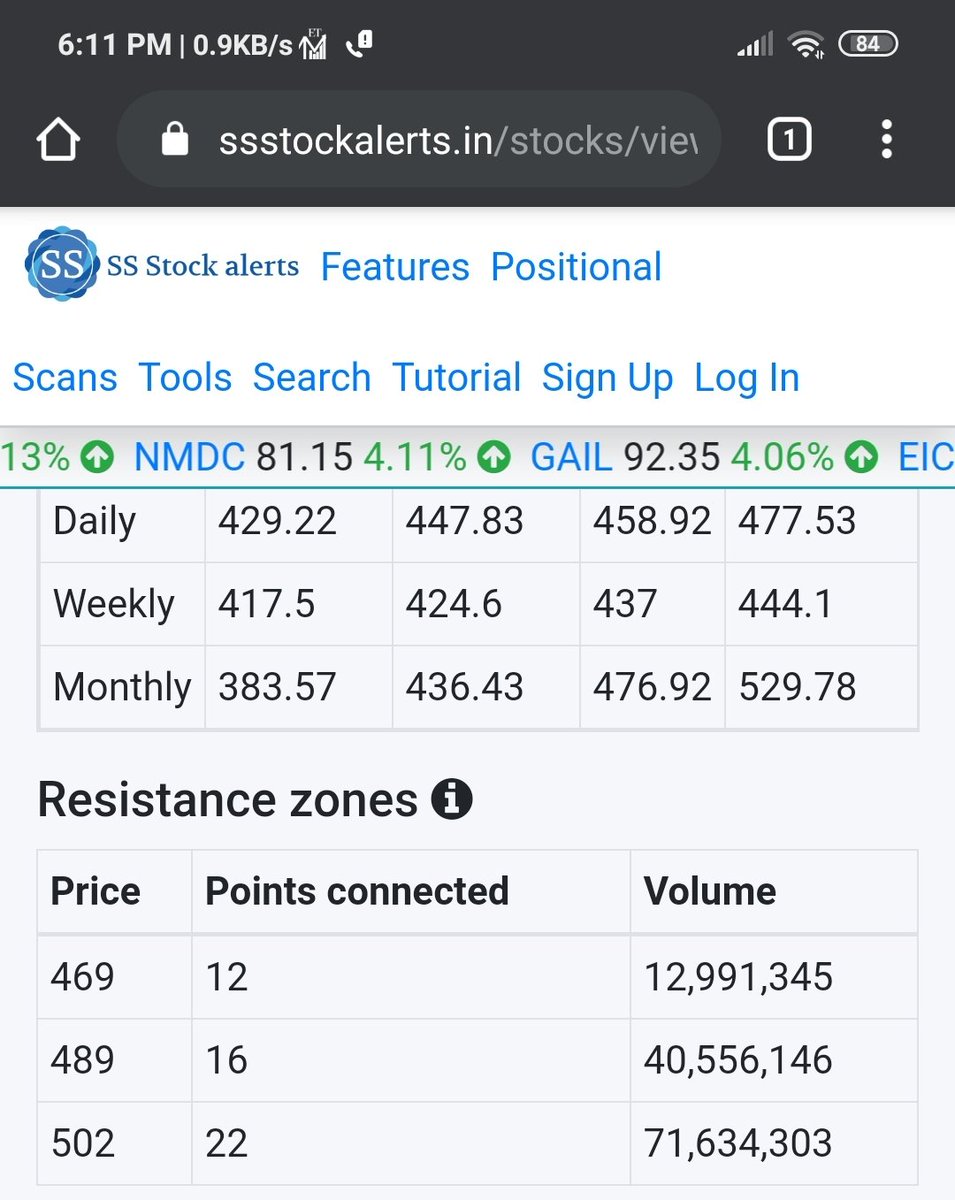
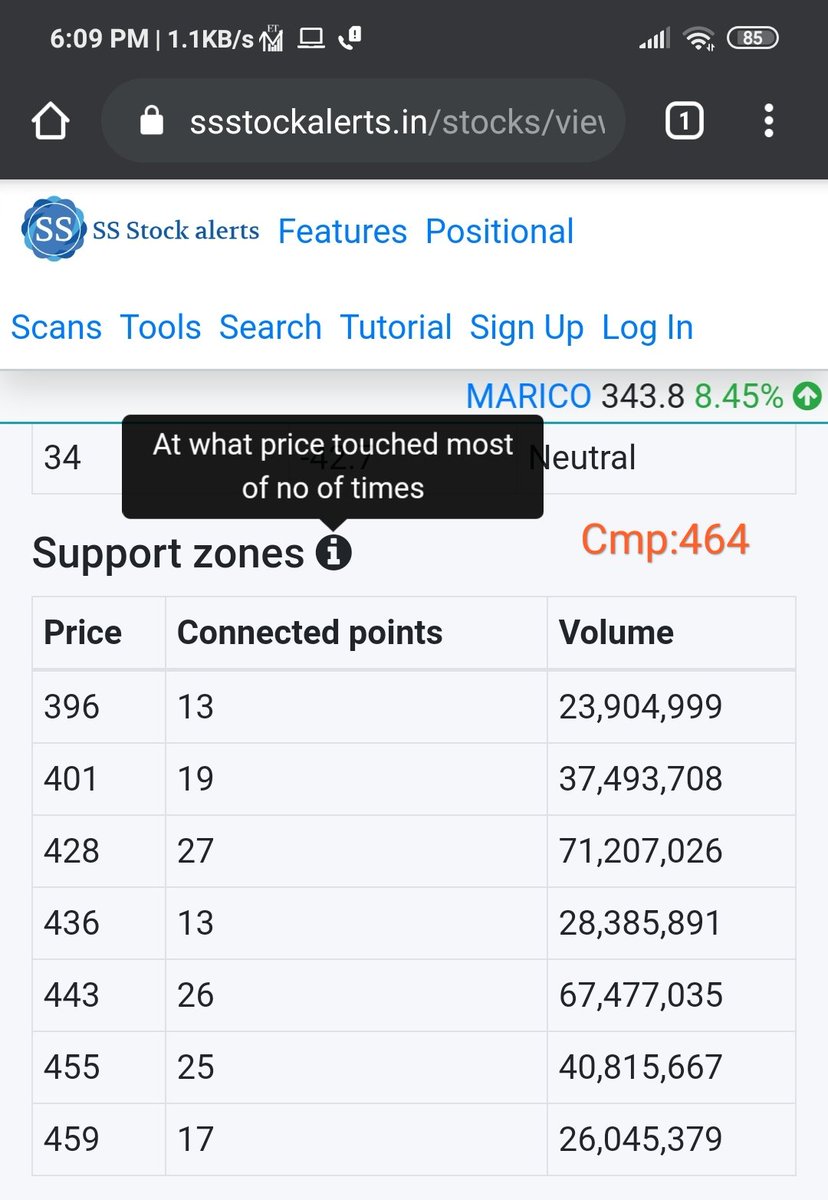 #supportzone
  #Vortex
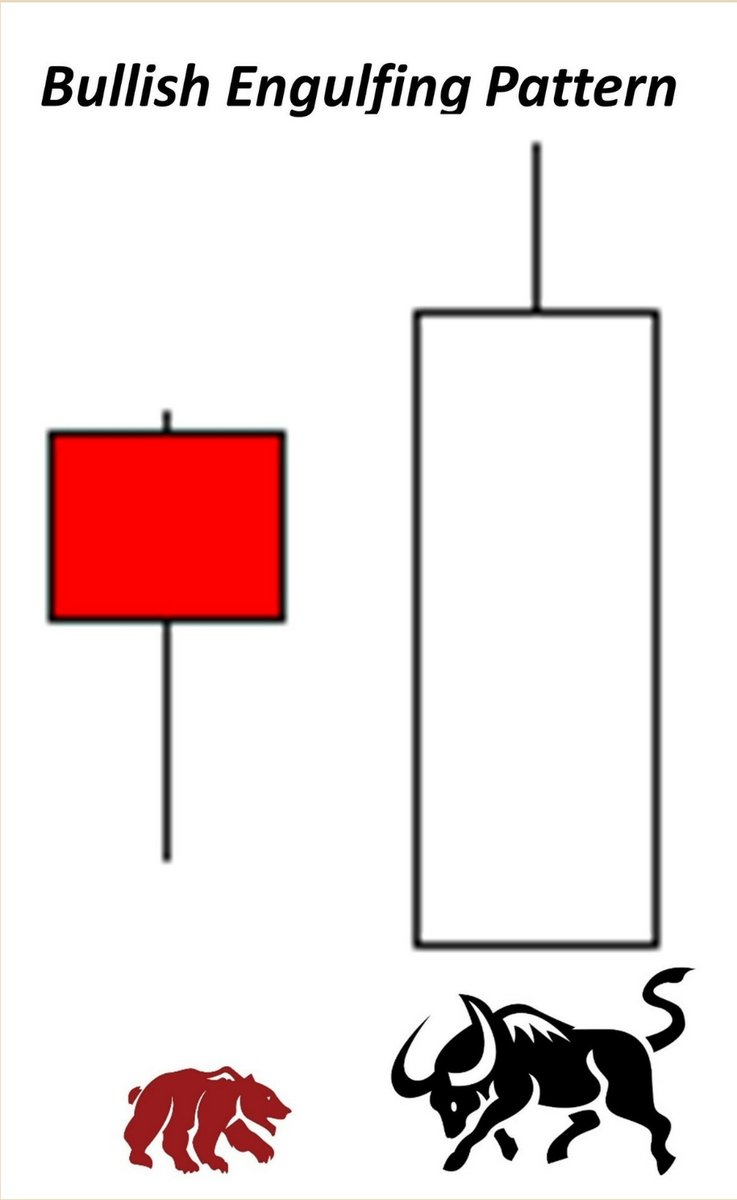 It represents a major defeat, so to speak, for the sellers and/or short sellers (the bears). When the second candlestick bar opens, the sellers are already pushing the prices below the prior candlestick’s close.
 #Ichimoku
  #MFI
#MFI  3. Get the stock info with detail analysts and score.
  #ADX
#ADX