My Authors
Read all threads
Analysis: #NYSE $SPOT

Case 340 #Spotify Technology S.A.

DISCLAIMER: The analysis is strictly for educational purposes and should not be construed as an invitation to trade.

#SPOT 1/3
Chart 1
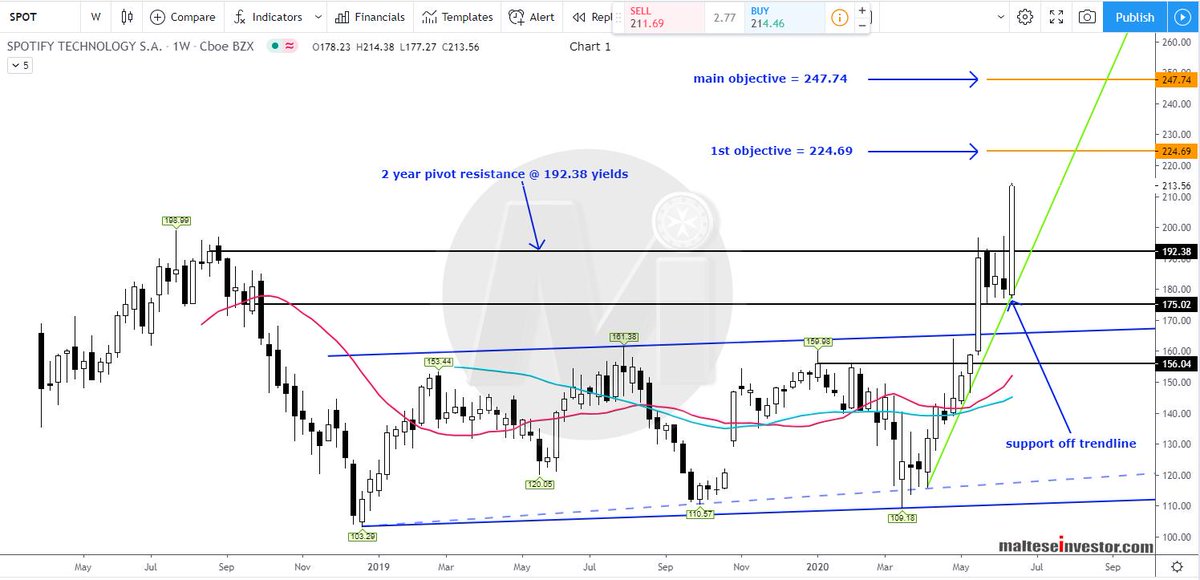
Weekly Chart: A #parabolic move which began in Apr. 2020 has seen price rise strongly, breaking above 2 year pivot #resistance at 192.38 and currently trading to new all time highs. The first objective is 224.69 with a close above targeting 247.74.

SPOT 2/3
Chart 2
Daily Chart: An unfilled gap has formed between 206.54-199.99 and #support begins around the lower end, then the 2 year broken #pivot at 192.38 now turned support.

The #Strategy is printed on the image.

$SPOT 3/3
Missing some Tweet in this thread? You can try to force a refresh.

Keep Current with malteseinvestor

Profile picture

Stay in touch and get notified when new unrolls are available from this author!

Read all threads

This Thread may be Removed Anytime!

Twitter may remove this content at anytime, convert it as a PDF, save and print for later use!

Try unrolling a thread yourself!

how to unroll video

1) Follow Thread Reader App on Twitter so you can easily mention us!

2) Go to a Twitter thread (series of Tweets by the same owner) and mention us with a keyword "unroll" @threadreaderapp unroll

You can practice here first or read more on our help page!

Follow Us on Twitter!

Did Thread Reader help you today?

Support us! We are indie developers!


This site is made by just two indie developers on a laptop doing marketing, support and development! Read more about the story.

Become a Premium Member ($3.00/month or $30.00/year) and get exclusive features!

Become Premium

Too expensive? Make a small donation by buying us coffee ($5) or help with server cost ($10)

Donate via Paypal Become our Patreon

Thank you for your support!