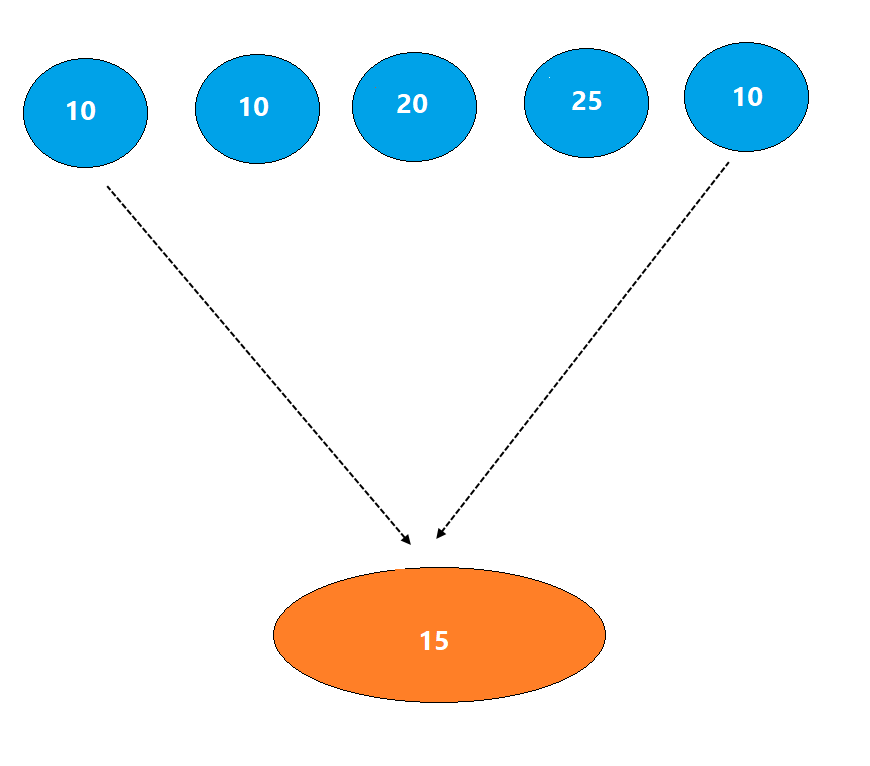
Bullish readings (Gain) are = 10, 25, 7, 20 & 8
Bearish reading (Loss) are = 8, 7, 5, 30 & 20
Let us calculate the simple average price of the gains & losses:
Bullish average = 14 ((10+25+7+20+8)/5)
Bearish average =14 ((8+7+5+30+20)/5)
It just means, over the last 10 days, average gains were 14 points and average losses 14 points.
These are absolute points. How to know how strong the bulls are?
Average gain was 14. So, RSI will be ((14/28) x 100) = 50%
So, when RSI is at 50, it means Average gain is equal to Average loss.
If total points are 30 and average gain is 9 – RSI would be at 30.
Got it?
Because of the averaging method, 75 – 25 can be considered as a normal range.
Wilder’s method of averaging is slow compared to other methods of averaging such as SMA, EMA, WMA etc.
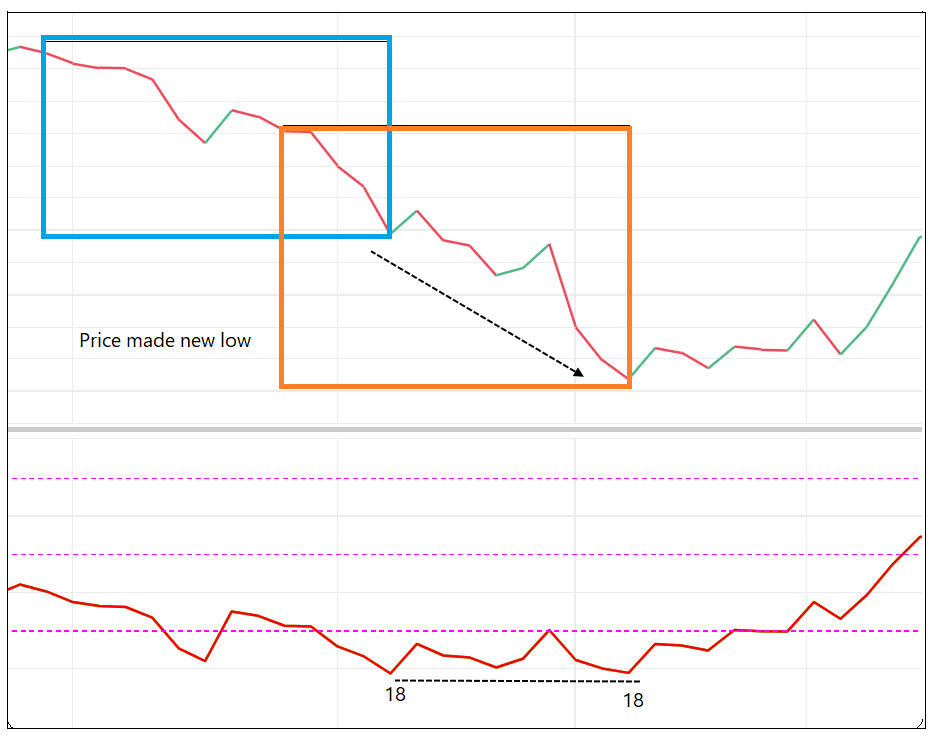
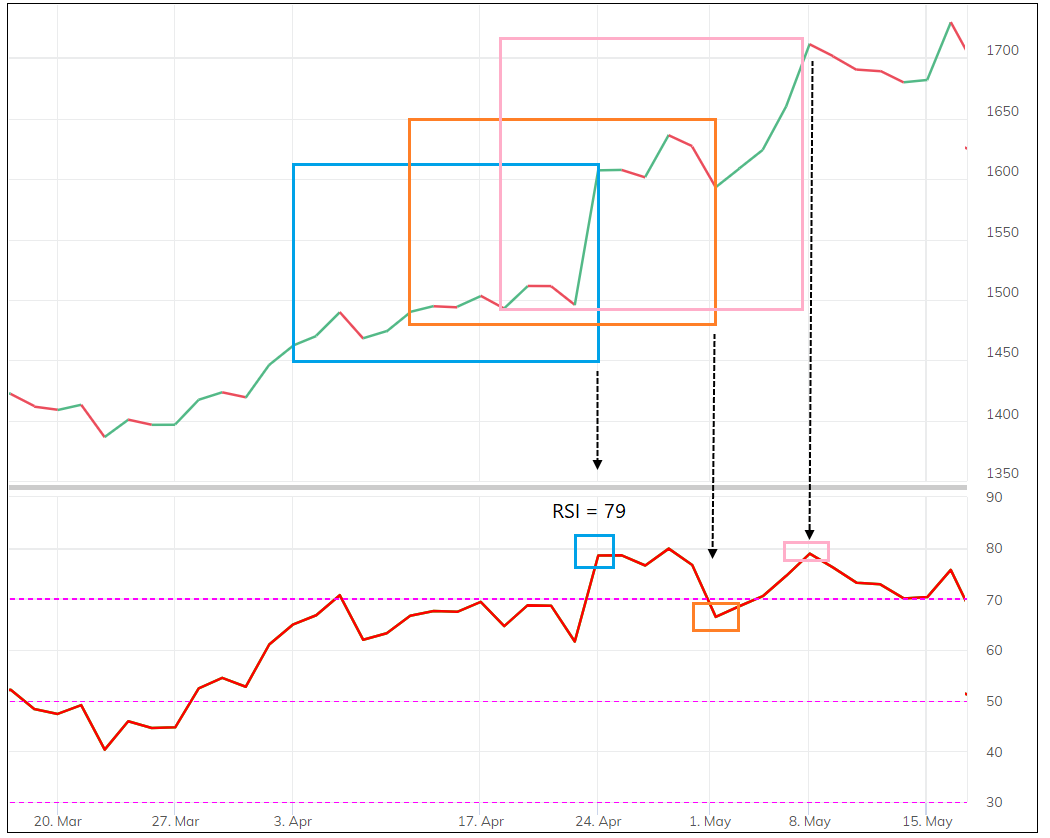
So, there is a virtual box of last 14 bars on price. If there is a strong bullish or bearish close during the 14 days – it can dominate the RSI reading.
There were some gains recorded on a few sessions in that Orange box that did not let the RSI fall rapidly.
Clear?
Average of RSI is known as signal line. It helps in smoothing the RSI data. Default parameter is 9 period.
<End of Thread>


