Analysis: #NYSE $DELL
Case 349 #Dell_Technologies Inc.
DISCLAIMER: The analysis is strictly for educational purposes and should not be construed as an invitation to trade.
#DELL 1/4
Case 349 #Dell_Technologies Inc.
DISCLAIMER: The analysis is strictly for educational purposes and should not be construed as an invitation to trade.
#DELL 1/4

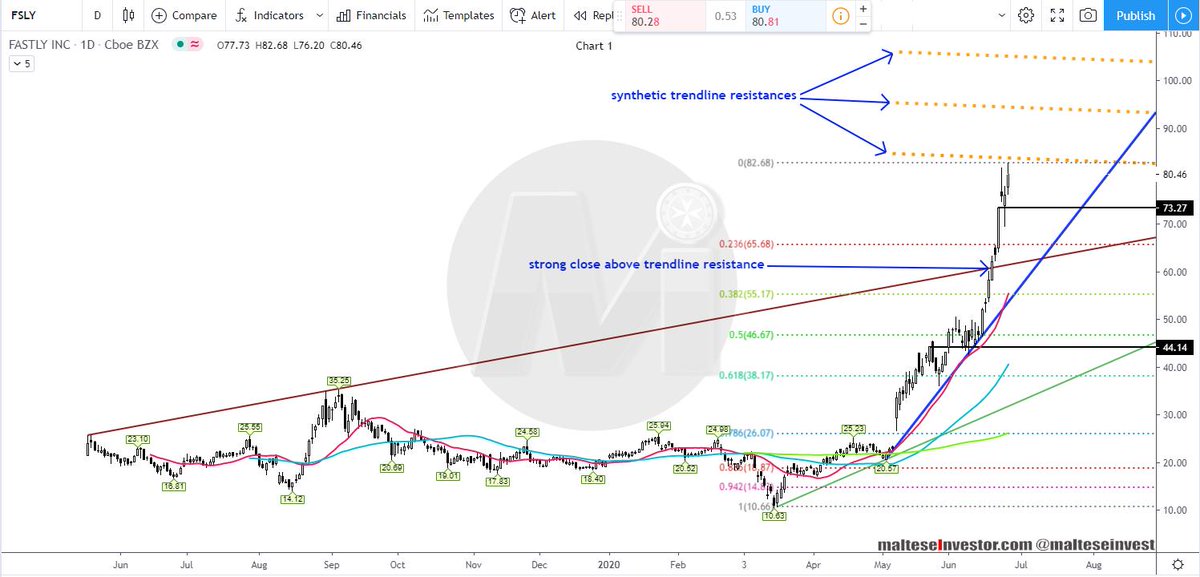
Chart 1
Weekly Chart: A strong move off the all time low at 25.51 has seen price smash through July 2019 trendline #resistance and the 11 month #pivot resistance at 56.80 is within sight - a close above will .....
DELL 2/4
Weekly Chart: A strong move off the all time low at 25.51 has seen price smash through July 2019 trendline #resistance and the 11 month #pivot resistance at 56.80 is within sight - a close above will .....
DELL 2/4
..... target the cluster base and Fib. 0.886 at 65.41 quickly. To the downside good #support begins at 46.55-45.81 (#trendline support and old range base) and below the #SMA 20 at 43.46.
DELL 3/4
DELL 3/4
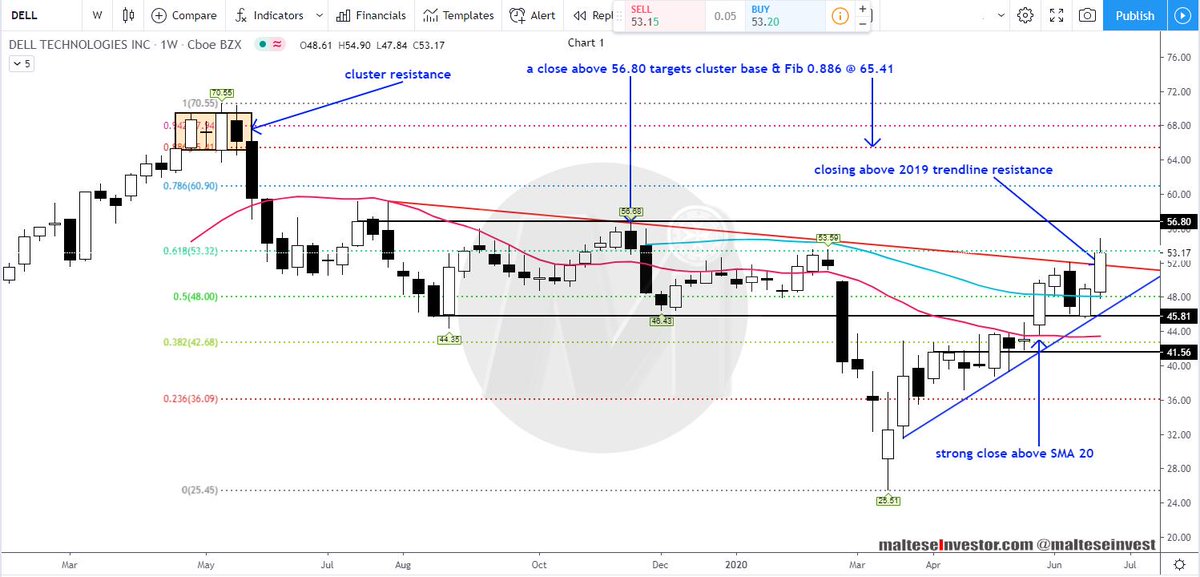
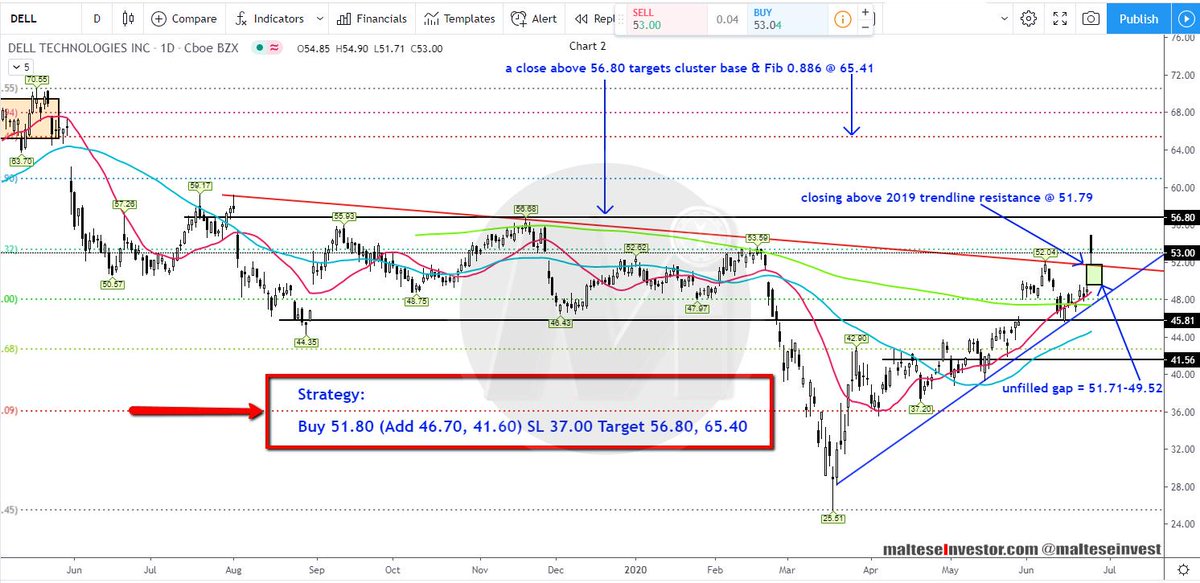
Chart 2
Daily Chart: An unfilled gap exists at 51.71-49.52 which sits below the broken July 2019 trendline at 51.79 and this is concerning.
The #Strategy is printed on the image.
$DELL 4/4
Daily Chart: An unfilled gap exists at 51.71-49.52 which sits below the broken July 2019 trendline at 51.79 and this is concerning.
The #Strategy is printed on the image.
$DELL 4/4