Chart 1
Daily Chart: A strong #parabolic move has seen price close above one year #trendline resistance and a new all time high of 82.68 has just been recorded - this has stopped short of synthetic #resistance at 83.93, a close above targets 94.34/68.
FSLY 2/3
Daily Chart: A strong #parabolic move has seen price close above one year #trendline resistance and a new all time high of 82.68 has just been recorded - this has stopped short of synthetic #resistance at 83.93, a close above targets 94.34/68.
FSLY 2/3
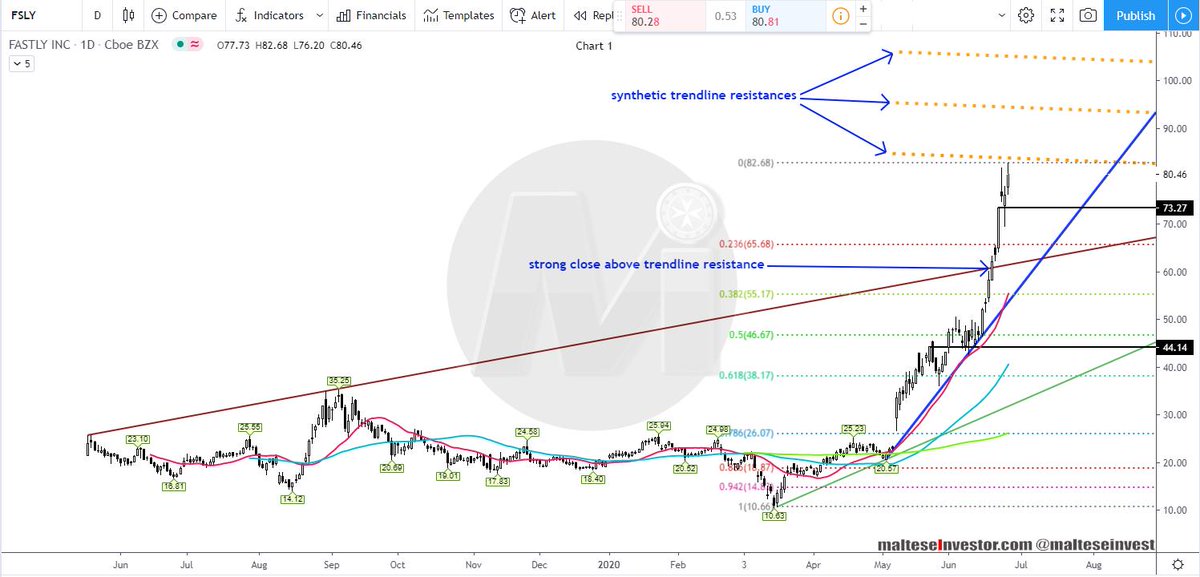
Chart 2
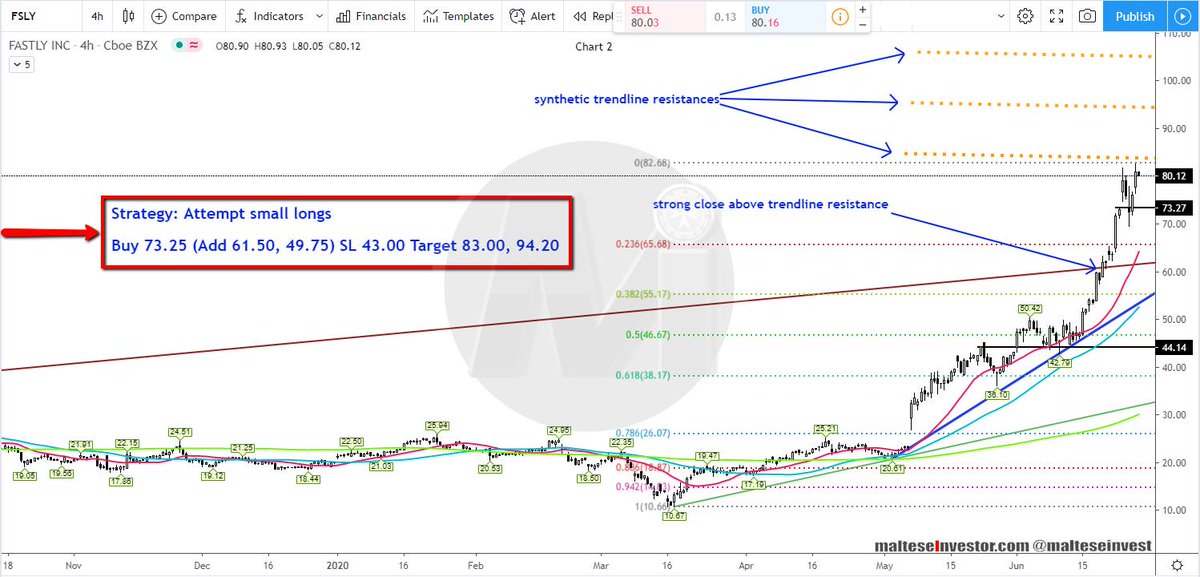
4 Hour Chart: Risk to reward considerations are poor as price has still not corrected lower since the parabolic move - attempt small buys.
The #Strategy is printed on the image.
$FSLY 3/3
4 Hour Chart: Risk to reward considerations are poor as price has still not corrected lower since the parabolic move - attempt small buys.
The #Strategy is printed on the image.
$FSLY 3/3