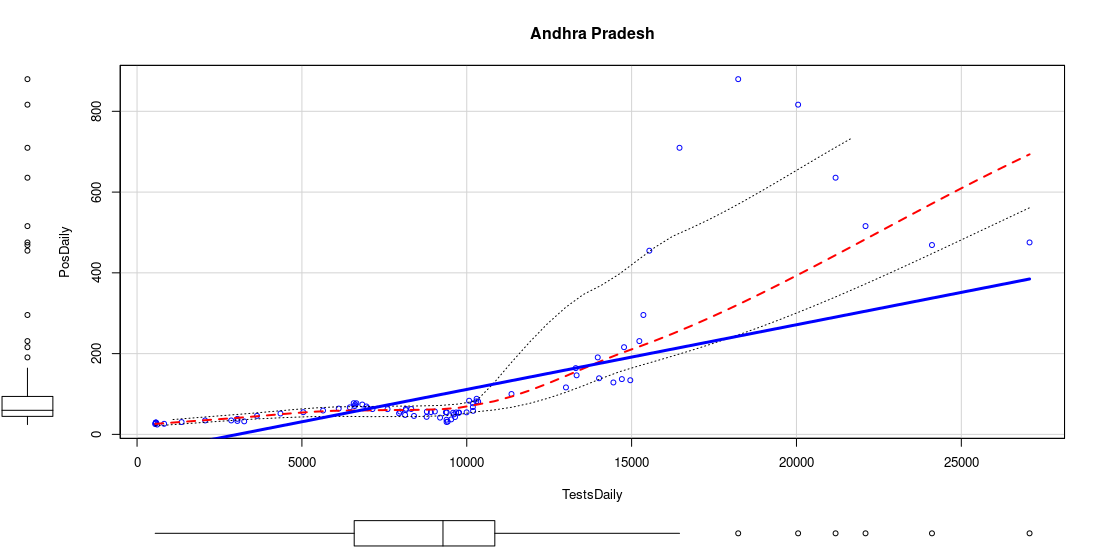
Coded in a slightly more informative workup for the testing by states. Boxplots on the axes indicate the average # of tests and positives per day. Straight line indicates expected positivity.
AP is testing high ...
+


Keep Current with G Raghuram
This Thread may be Removed Anytime!
Twitter may remove this content at anytime, convert it as a PDF, save and print for later use!

1) Follow Thread Reader App on Twitter so you can easily mention us!
2) Go to a Twitter thread (series of Tweets by the same owner) and mention us with a keyword "unroll"
@threadreaderapp unroll
You can practice here first or read more on our help page!