Analysis: #NASDAQ $OVID
Case 353 #Ovid_Therapeutics Inc.
DISCLAIMER: The analysis is strictly for educational purposes and should not be construed as an invitation to trade.
#OVID 1/4
Case 353 #Ovid_Therapeutics Inc.
DISCLAIMER: The analysis is strictly for educational purposes and should not be construed as an invitation to trade.
#OVID 1/4

Chart 1
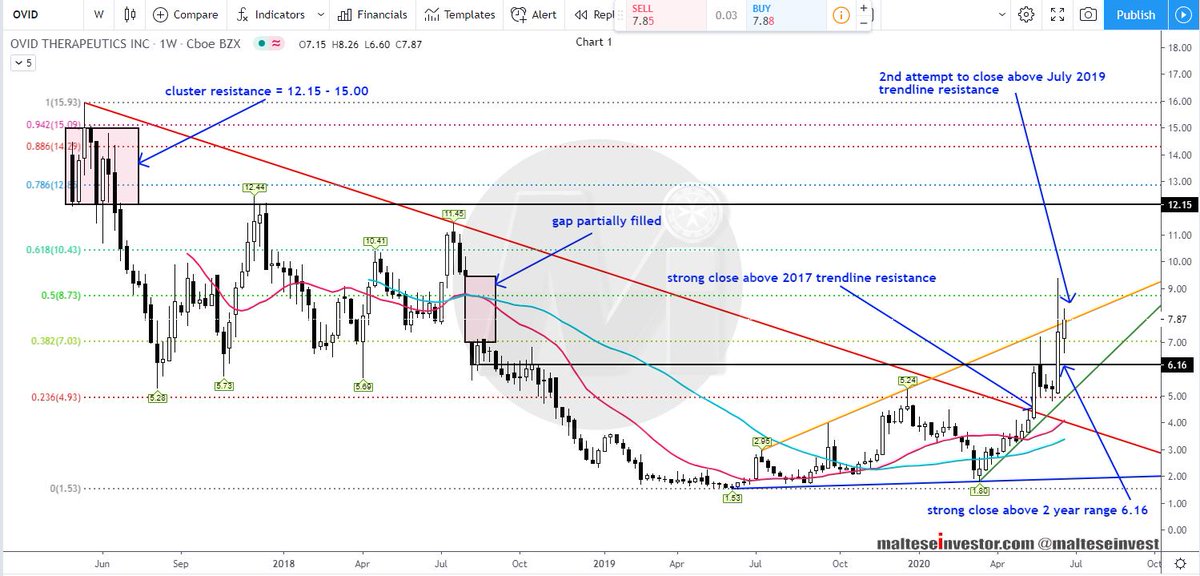
Weekly Chart: Price has risen off the lows, closing strongly above the 2017 #trendline resistance and the 2 year range at 6.16. The gap is still unfilled but #momentum is strong and conditions are #bullish - the immediate target .....
OVID 2/4
Weekly Chart: Price has risen off the lows, closing strongly above the 2017 #trendline resistance and the 2 year range at 6.16. The gap is still unfilled but #momentum is strong and conditions are #bullish - the immediate target .....
OVID 2/4
..... is 11.00/45. Strong cluster #resistance is seen at 12.15-15.00 - we assume failure at the first attempt but envisage an eventual target of 19.70 further out.
OVID 3/4
OVID 3/4