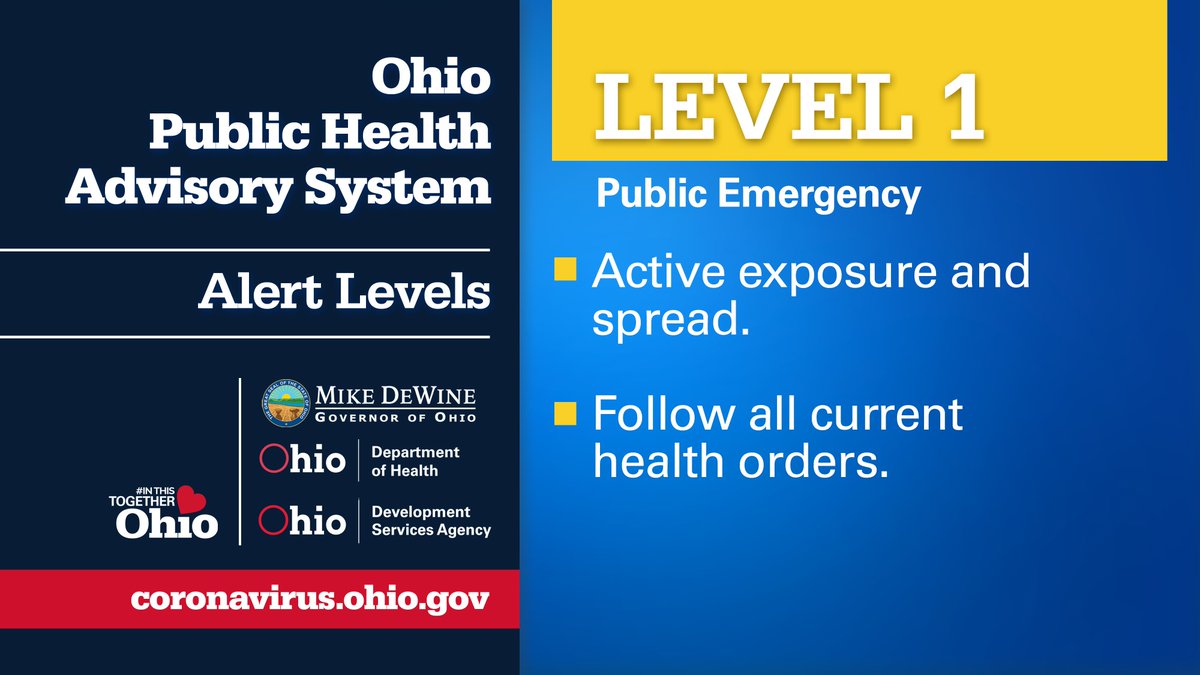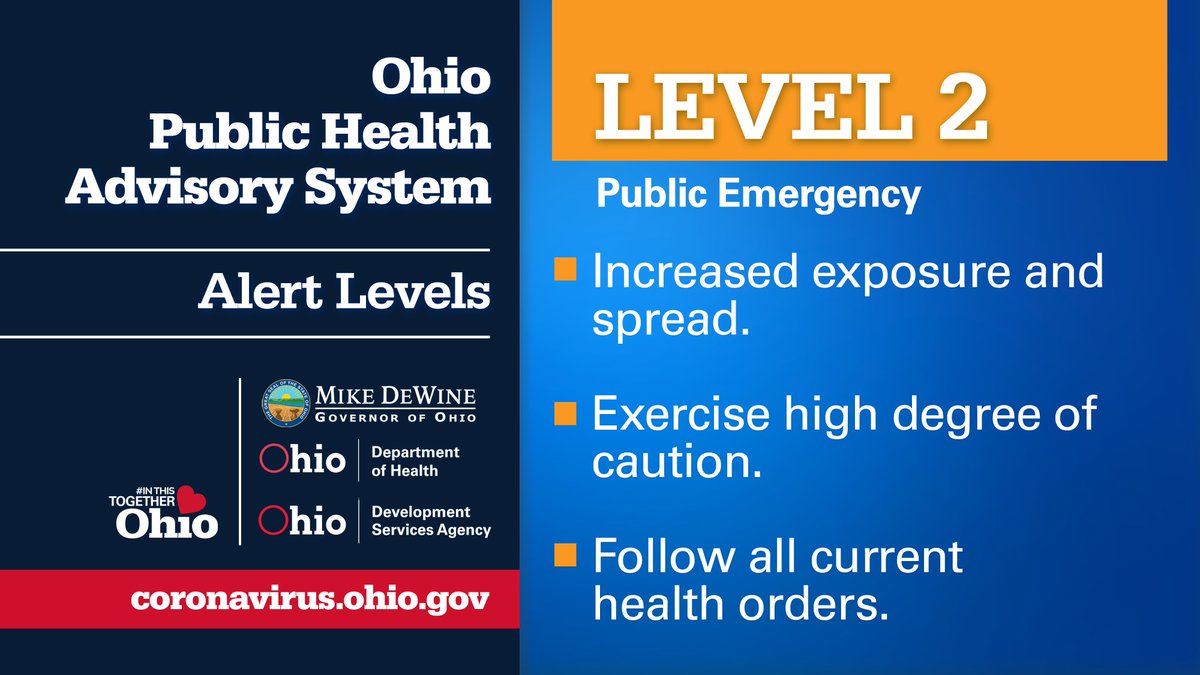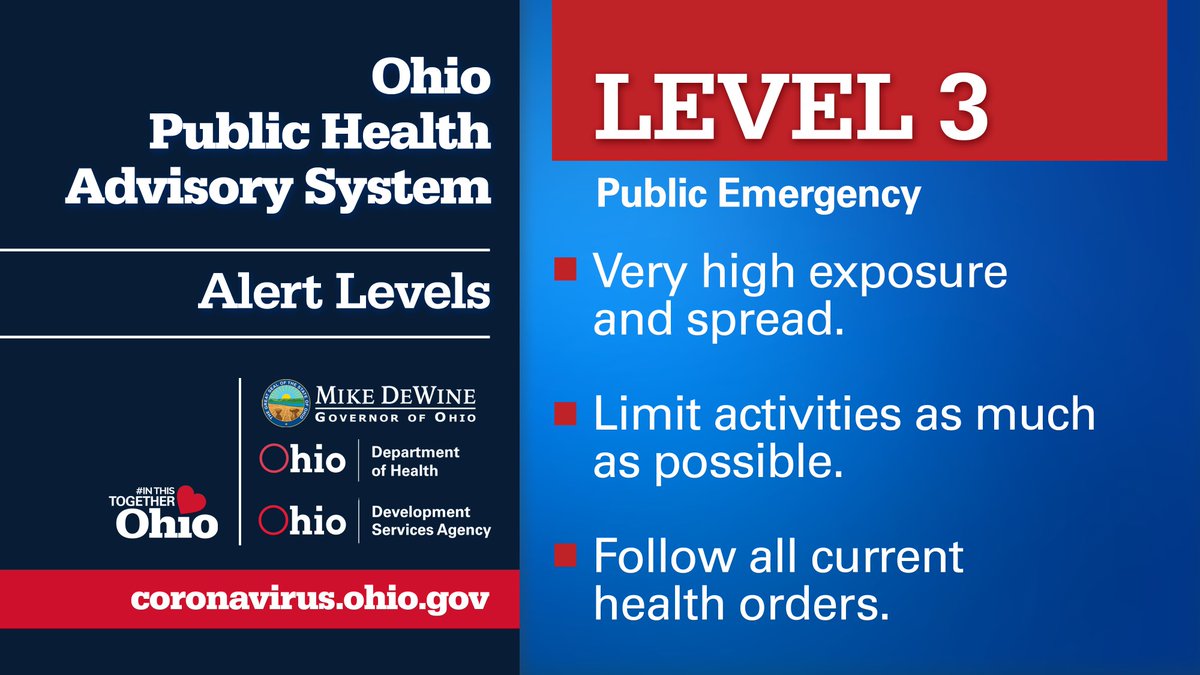
The system has 4 levels to provide Ohioans w/ guidance on the severity of the problem in the counties in which they live. The levels are determined by 7 data indicators that identify the risk level for each county and a corresponding color code to represent that risk level.
NEW CASES PER CAPITA: When the data show that a county has had an average of 50 cases per 100,000 people over a 2-week period, that triggers a flag for an increasing case rate. Using this data means we are taking into account population of a county when monitoring case increases 
SUSTAINED INCREASE IN NEW CASES: If the number of new cases in a county continually increases, that’s another indicator of virus spread. A county will be flagged for meeting this indicator if the data show at least a five-day period of sustained new case growth.
PROPORTION OF CASES NOT CONGREGATE CASES: Data showing more than 50% of new cases originating from non-congregate settings during at least one of the past three weeks will trigger a flag on this indicator.
SUSTAINED INCREASE IN ER VISITS: ER data will show us the trend in the number of people who visit an emergency department with #COVID19 symptoms or a COVID diagnosis as a result of the visit. A county is flagged when there is an increase in such ER visits over a five-day period.
SUSTAINED INCREASE IN OUTPATIENT VISITS: This data set looks at the number of people visiting outpatient settings, including telehealth appointments, with suspected or confirmed #COVID19 symptoms. A county is flagged when there is an increase over a five-day period.

SUSTAINED INCREASE IN NEW #COVID19 HOSPITAL ADMISSIONS: When the numbers show at least a five-day period of sustained growth in the number of county residents with COVID-19 who are admitted to a hospital, the county will be flagged for meeting this indicator.
ICU BED OCCUPANCY: This indicator looks at regional data for both #COVID19 and non-COVID use of ICU beds. A county is flagged for this indicator when the regional ICU occupancy goes above 80% for at least three of the last seven days.

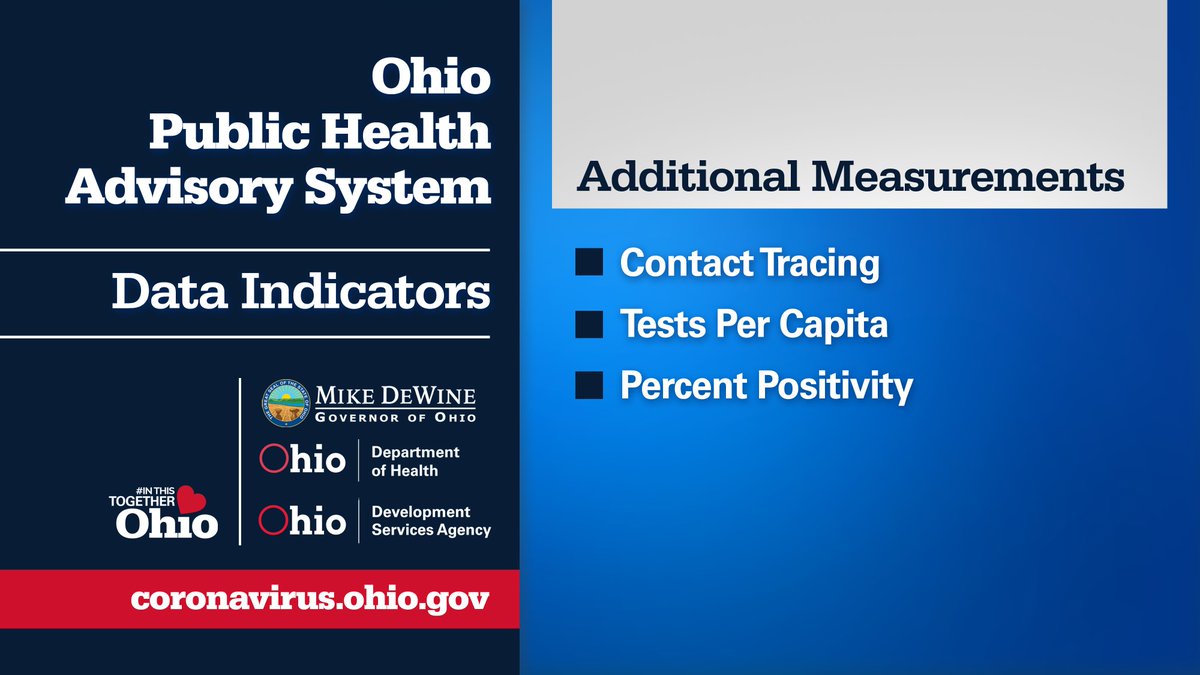
We are also working to refine additional measurements so that we can drill down even further on risk-levels. ⬇