1/25🇸🇪 Third comprehensive 🧵 compiling my graphs✍🏽 but where did it begin? Does anyone remember when stores were all out of toilet paper & #covid19 panic started to build? At that point I wanted to put things into perspective quite like @InProportion2 has done+ #COVID19sverige 
2/25 but first a few words on 🇸🇪. We are a country with most of it inhabitants living in Stockholm and south of Stockholm. The north is not as densely populated as Stockholm at 5200, Gothenburg at 1300 and Malmö at 2200 individuals per square km+
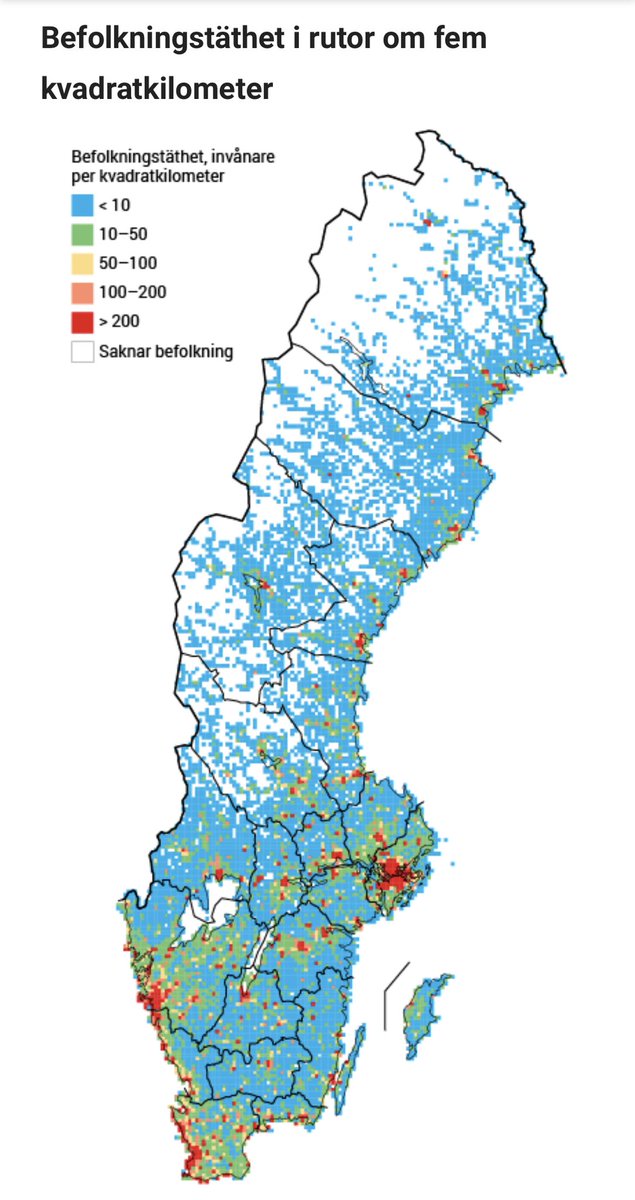
3/25 our population grew with ca 16% since year 2000 and ca 20% of people living in Sweden are born abroad. Largest immigrant population is 1) Syrians and 2) Iraqi. In Stockholm, Gothenburg and Malmö some 20-25% are born abroad.+
4/25 google ‘people that travel the most’ and you will find Sweden right at the top of most lists. The idea of who we are and the nature of our reality might not always be the same. Reality is more complex. Now back to #covid19 and my comparison of Sweden to... Sweden+
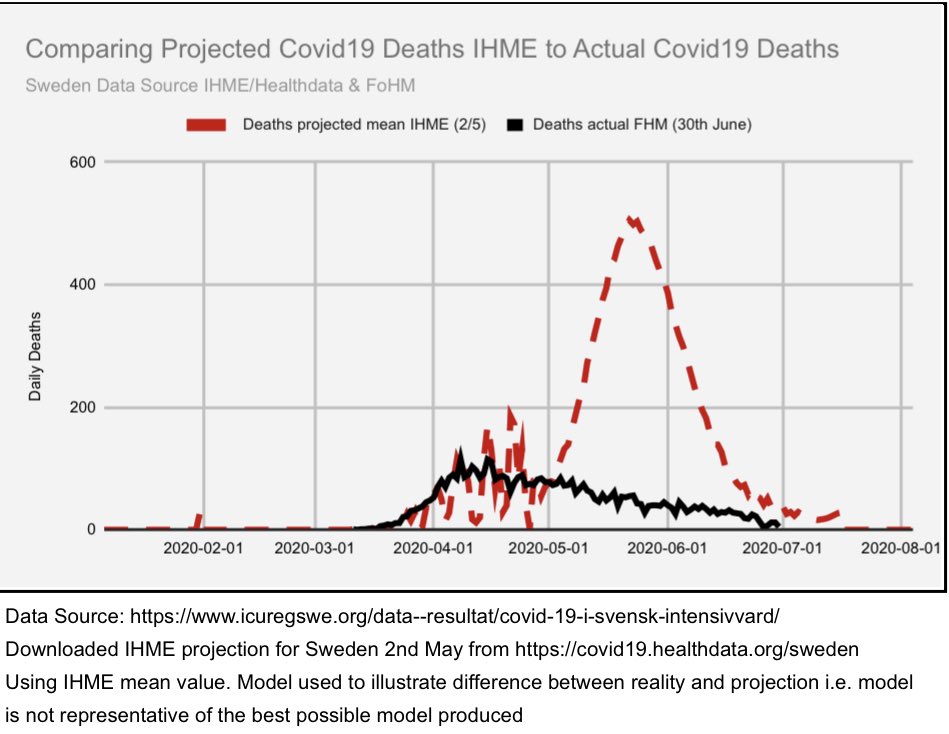
5/25 as shown, reality proved different than projections, but it was partly those projections that informed our response. Early on I stumbled upon @JenniferWegerup which provided data on 🇮🇹 regarding for example age distribution which is similar to the Swedish dist+
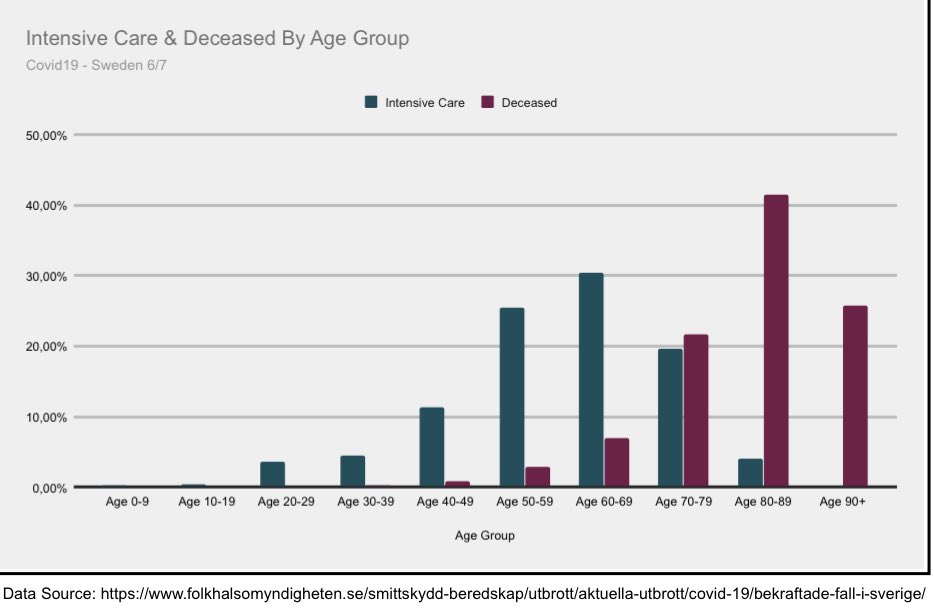
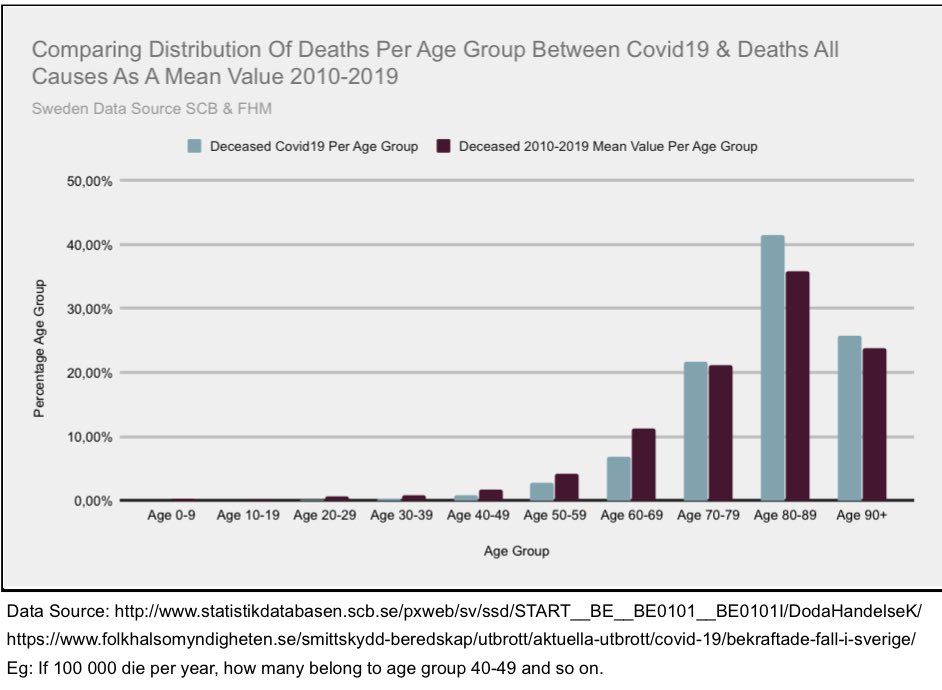
6/25 her presentations showed that deaths primarily occurred in elderly and people with comorbidities. Now this should tell us something in contrast to the narrative of everyone at great risk. It’s been shown that the same age component is valid in Sweden as well+ #COVIDー19
7/25 with ca 89% of deaths above 70 and more than twice as many above 90 as under 70 we see that #covid19 is greater risk to elderly than working & school population. But further+
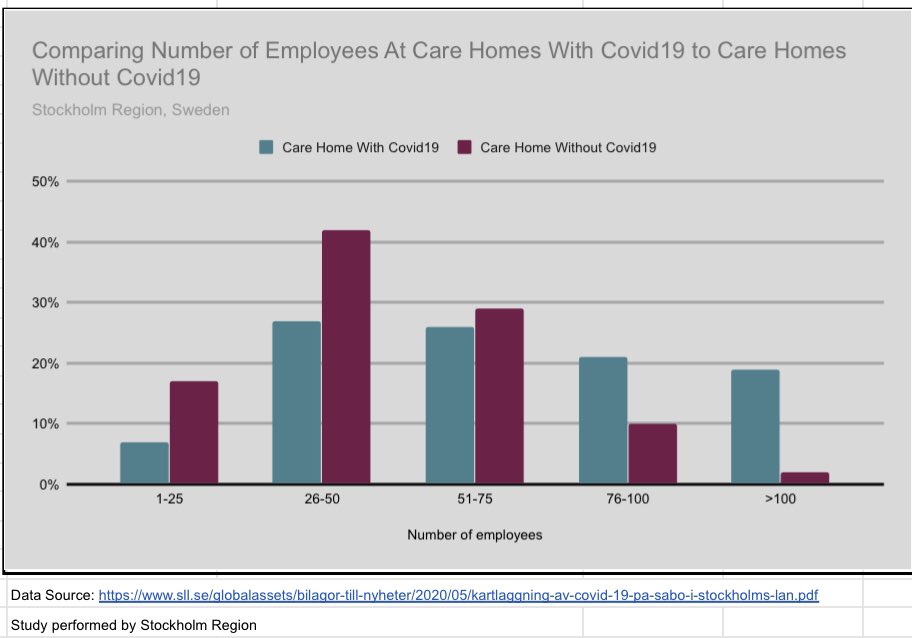
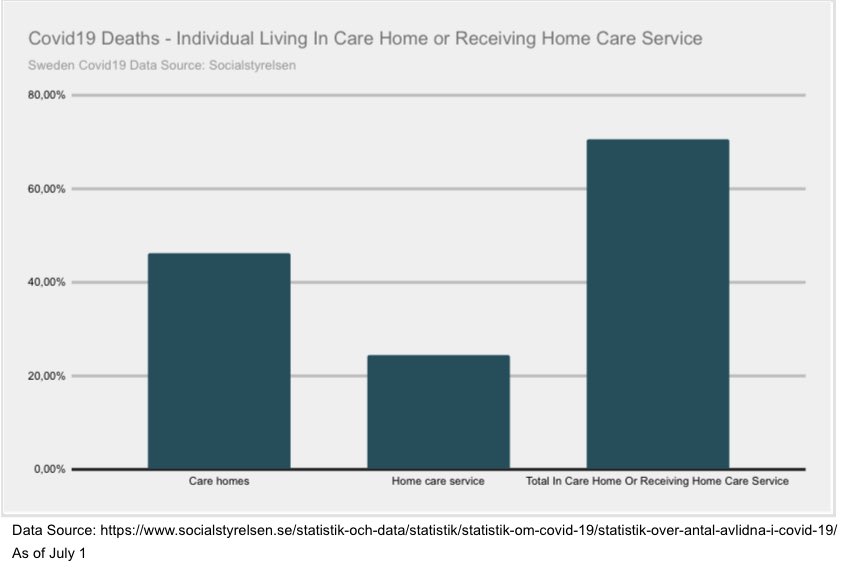
8/25 we see that within the age group 70+ almost half of individuals deceased have been care home residents and additional ca20% receiving home care service. This means that within a small % of the population we have more than half of #covid19 deaths.+ (see chart in next tweet)
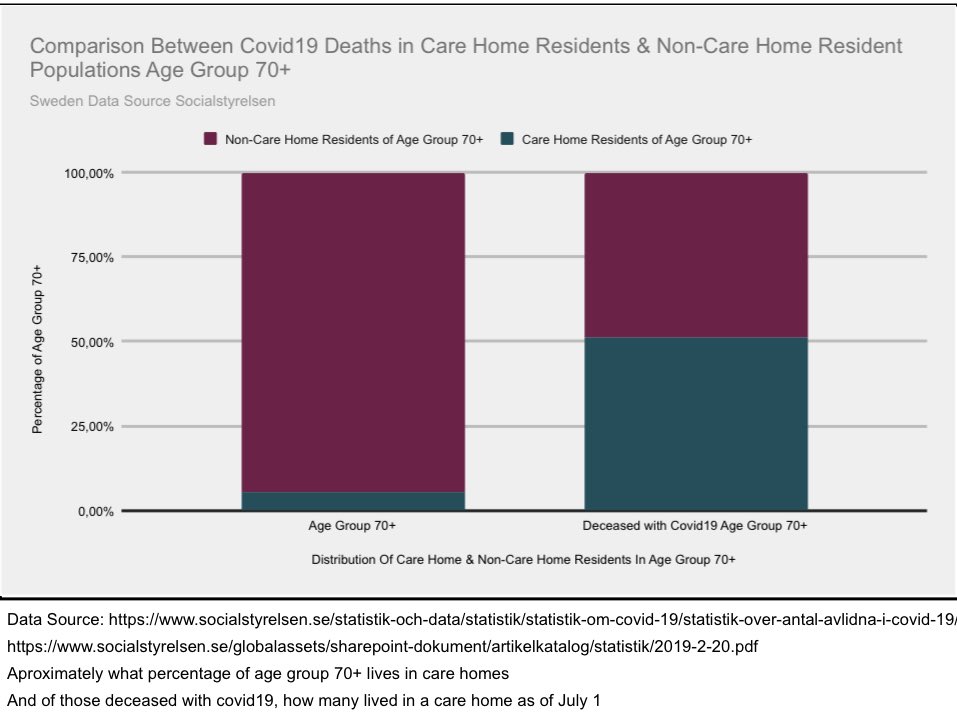
9/25 according to a study, half of the individuals moving in to care homes only lived there 2 years before dying. It’s already a quite fragile population. But perhaps also individuals who need human connection and not distancing during this pandemic, chart shows age 70+
10/25 as mentioned in the beginning I wanted to gain some perspective. For this reason I compared deaths all causes in different ways. As can be seen in this chart trend is slightly downwards but year 2019 was very low. Actually fewest deaths since 1977+ #COVID19sverige
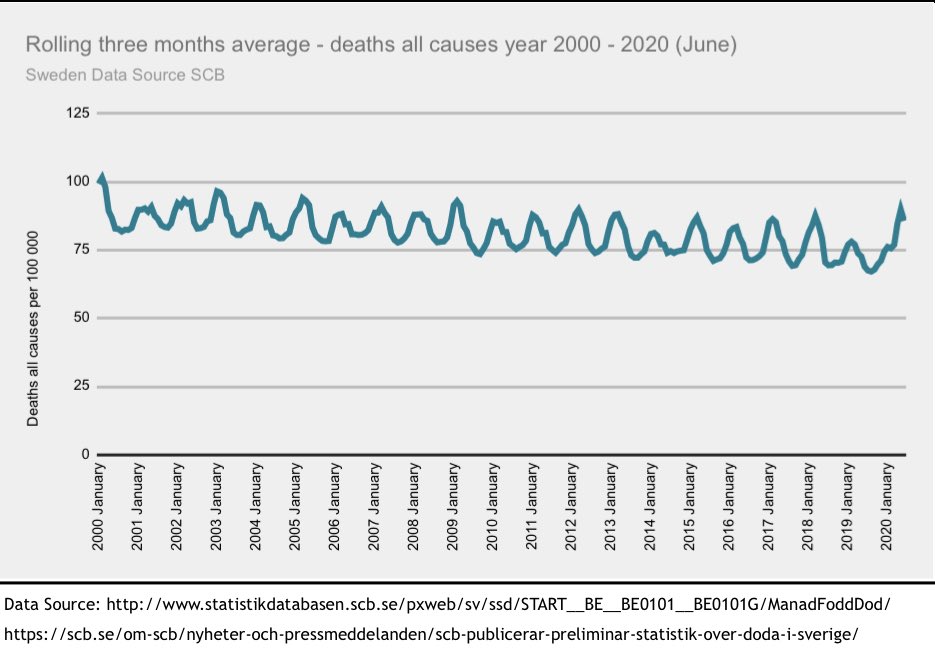
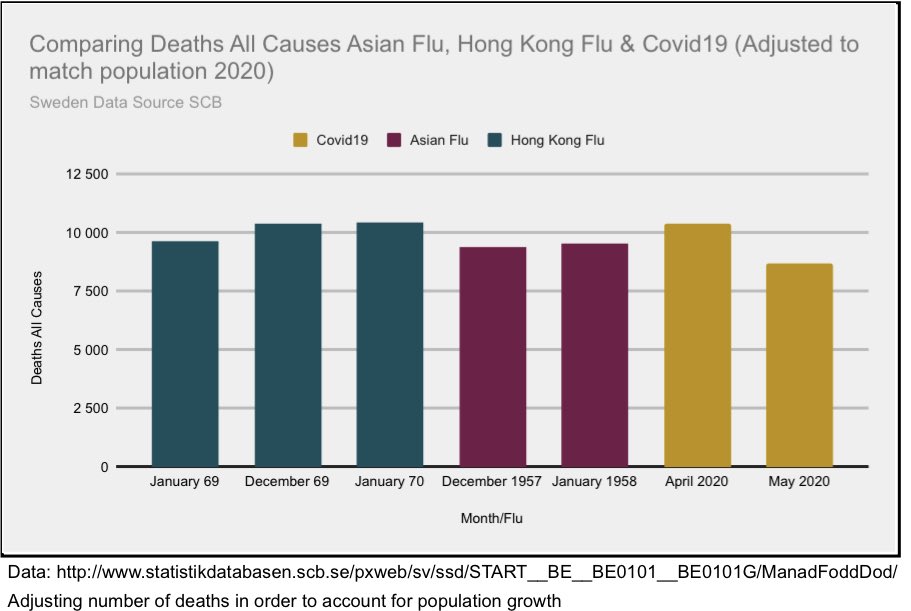
11/25 I asked myself, in the longer perspective do we see what could be seen in 1919? Or how would it compare with deaths all causes during Hong Kong flu or Asian flu?+
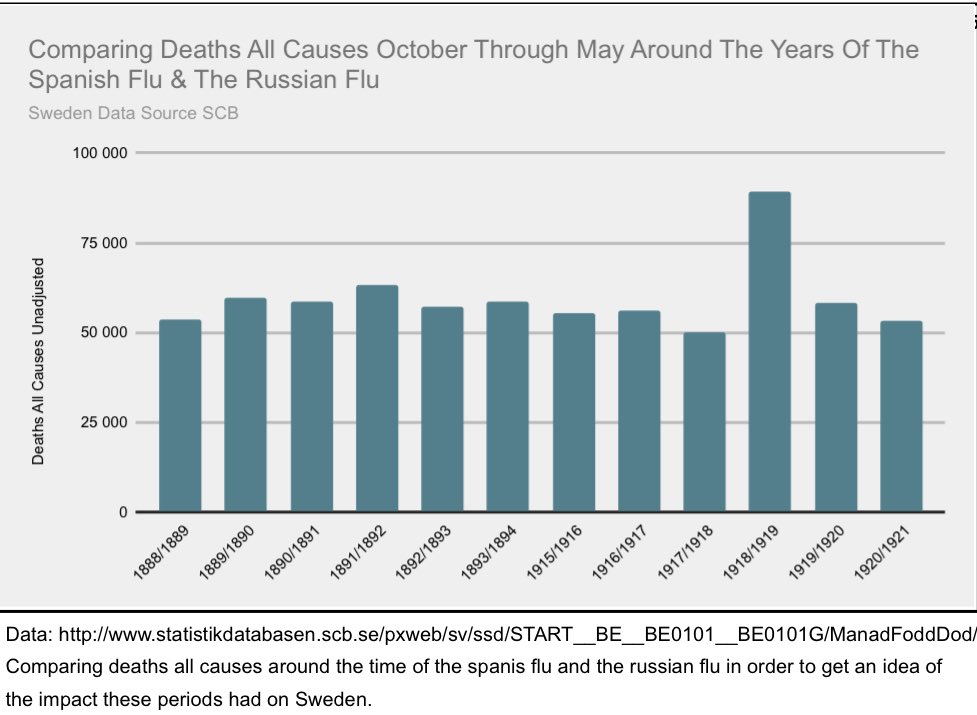
12/25 these events are events that my mother don’t remember in any apocalyptic manner.+
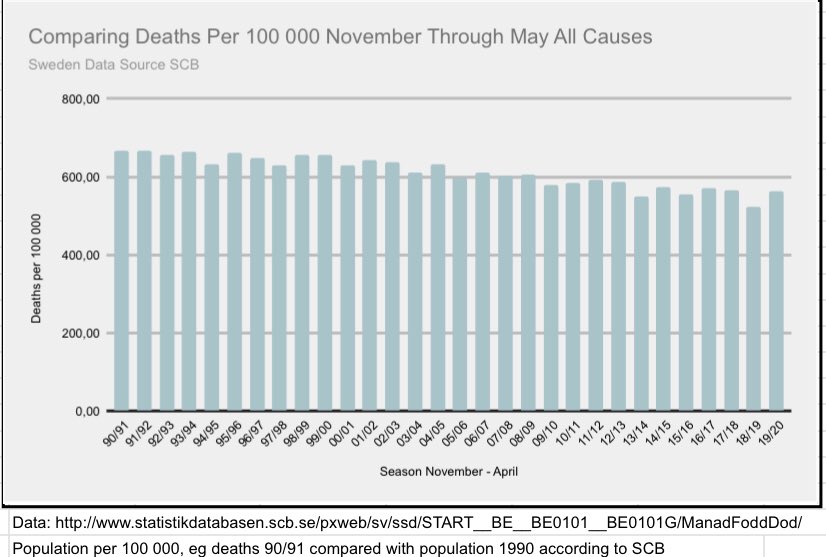
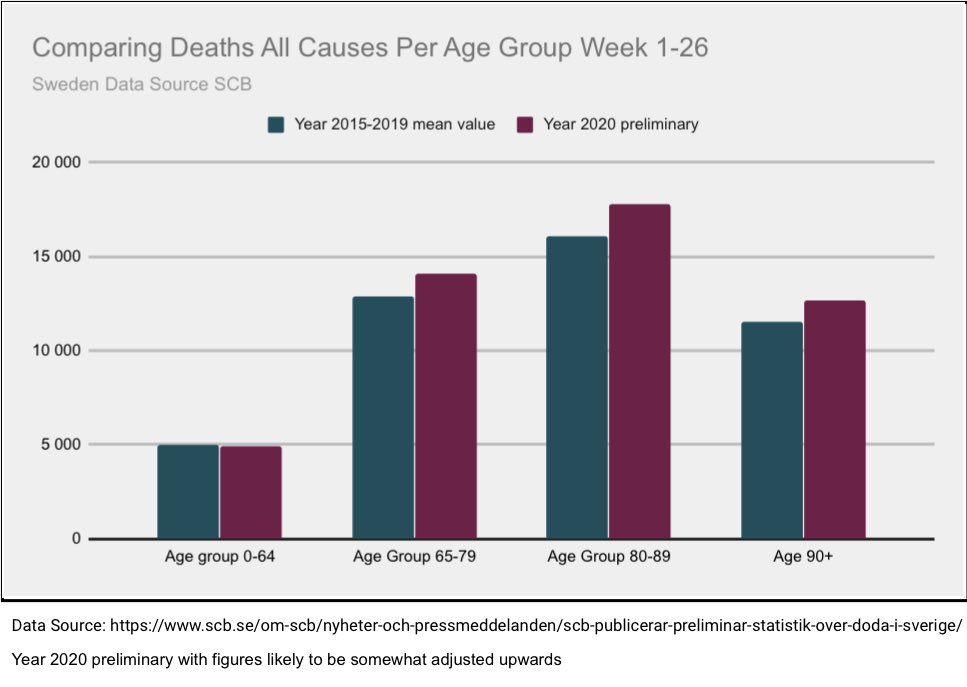
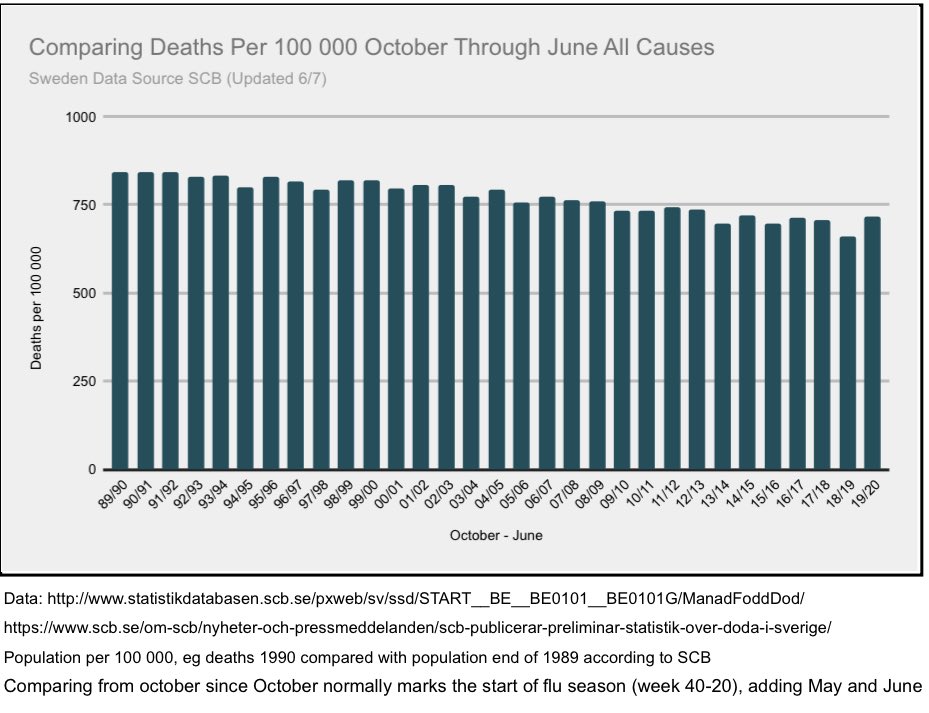
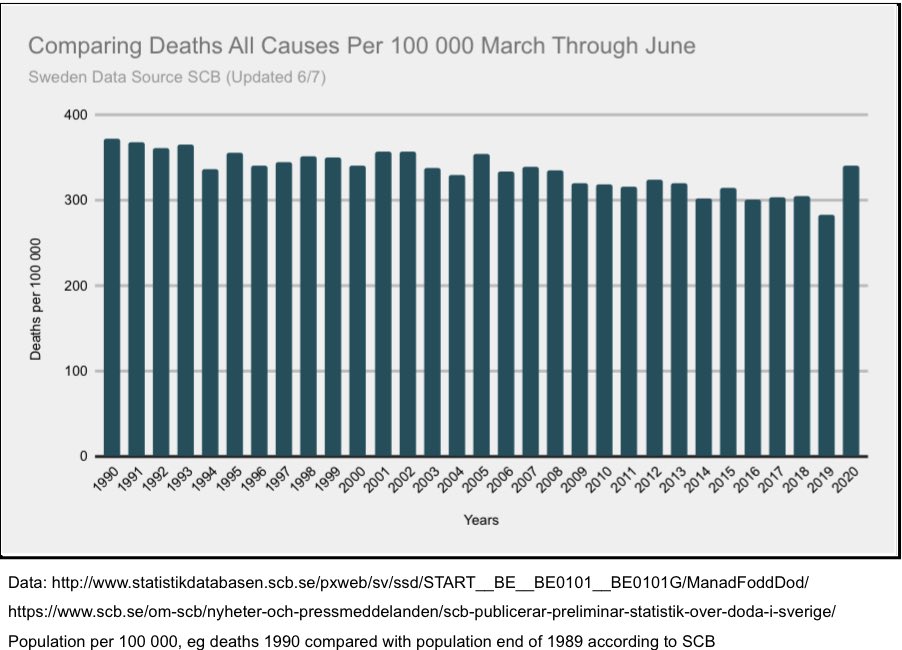
13/25 But that was some time ago, so what does it look like in more recent history. Comparing period 1990-2020 deaths all causes we first look at October through June+ #covid19
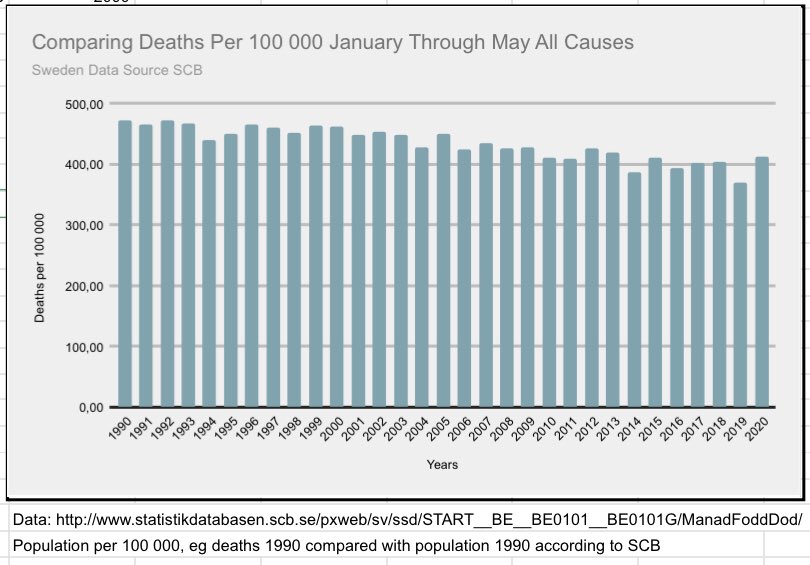
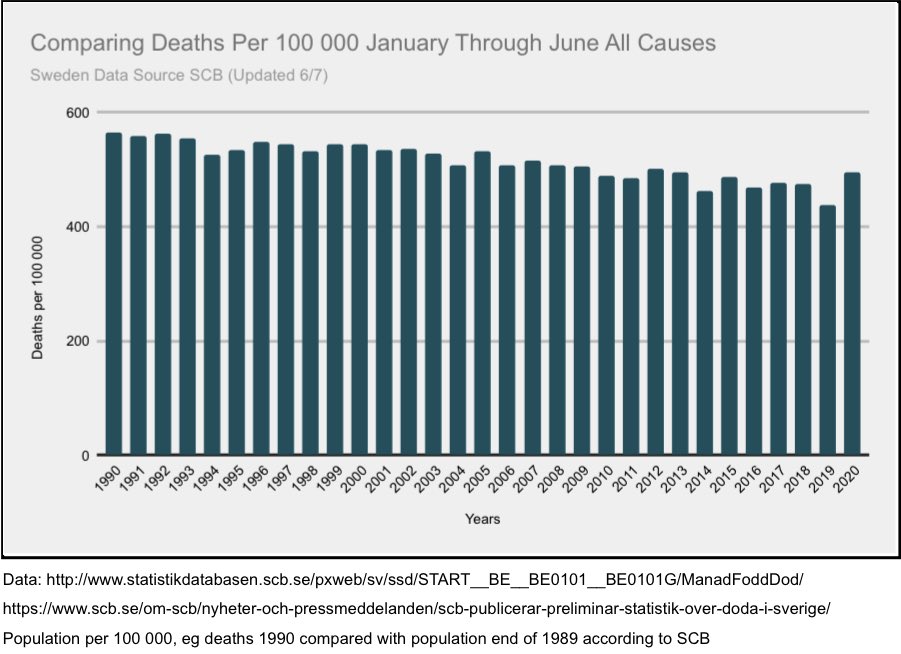
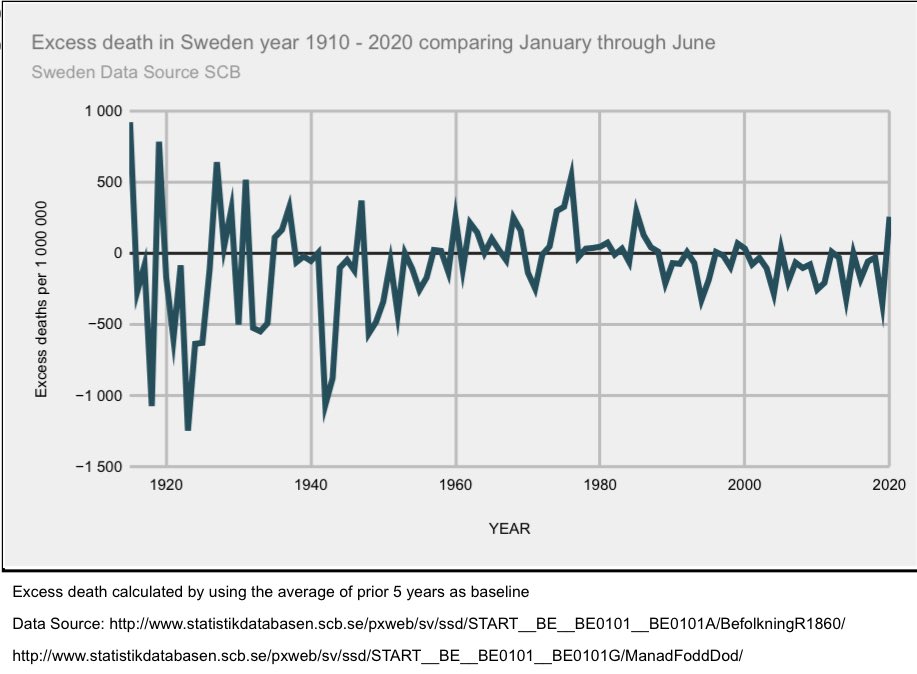
14/25 next we look at comparison January through June. We should also keep in mind what message was broadcasted in February, so as to remember the context.+ #COVID19sverige
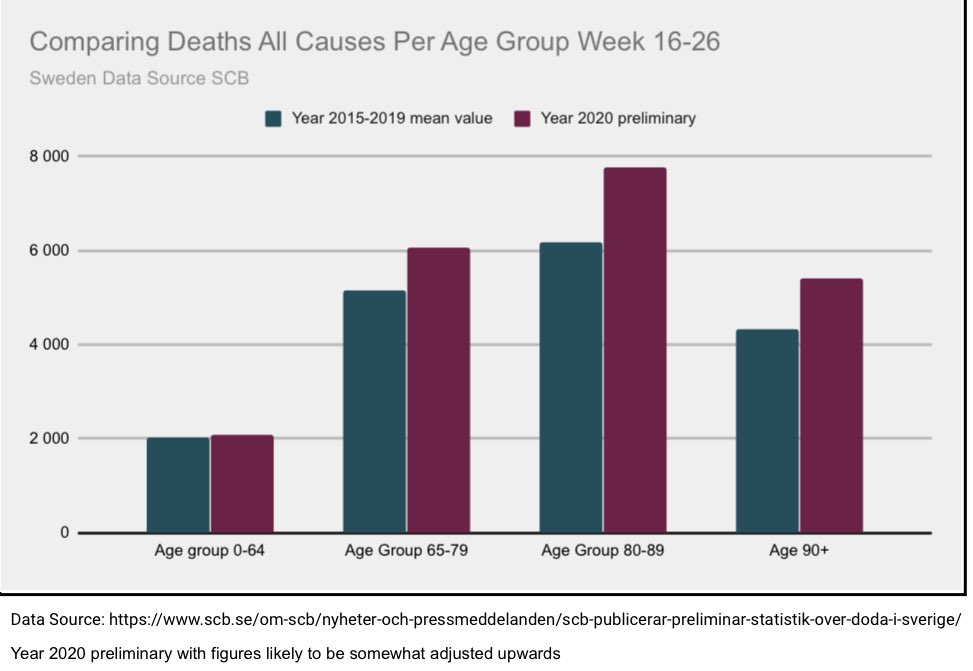
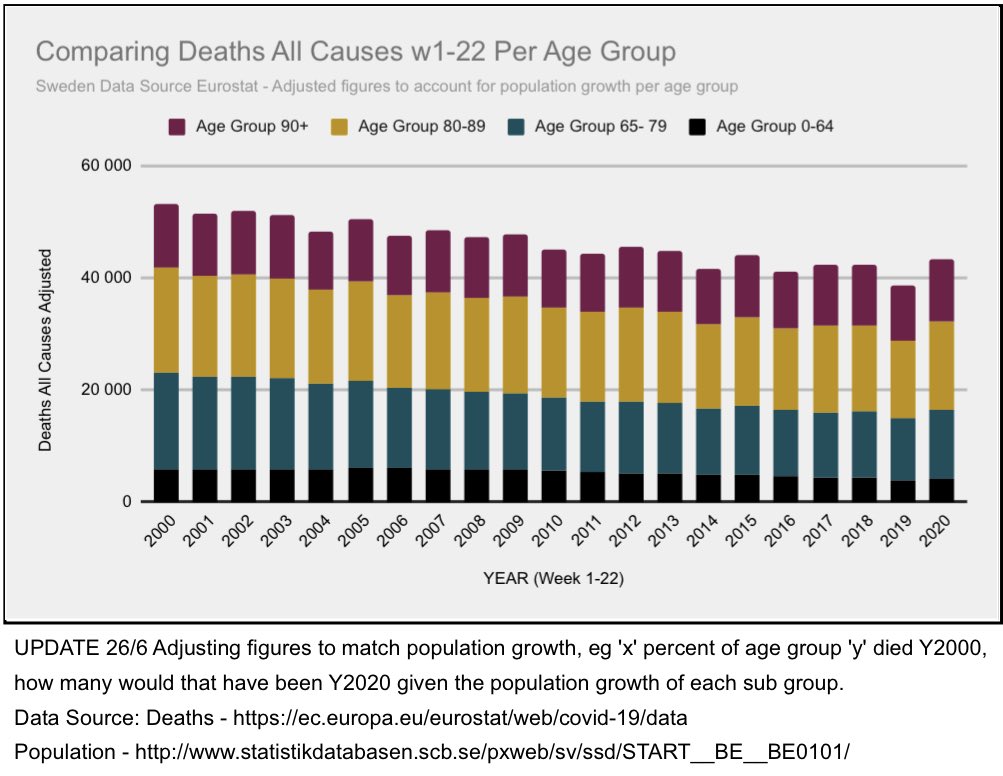
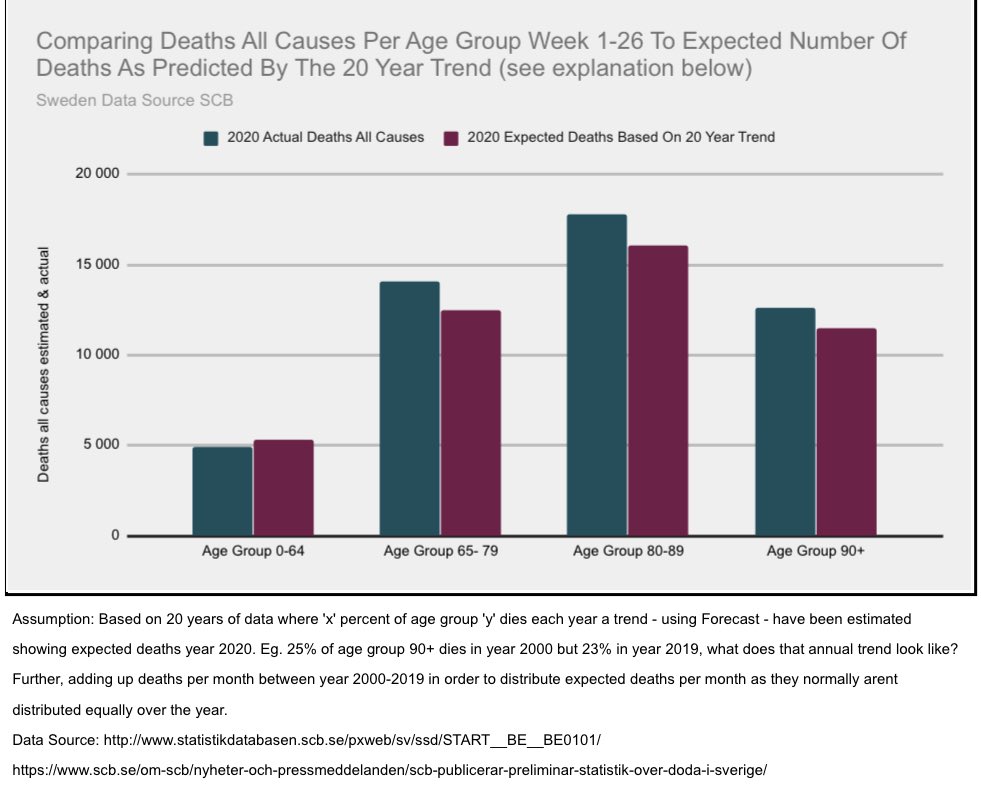
15/25 in this graph we look at comparison january through June but stratified using age (only week 1-22) but message the same.
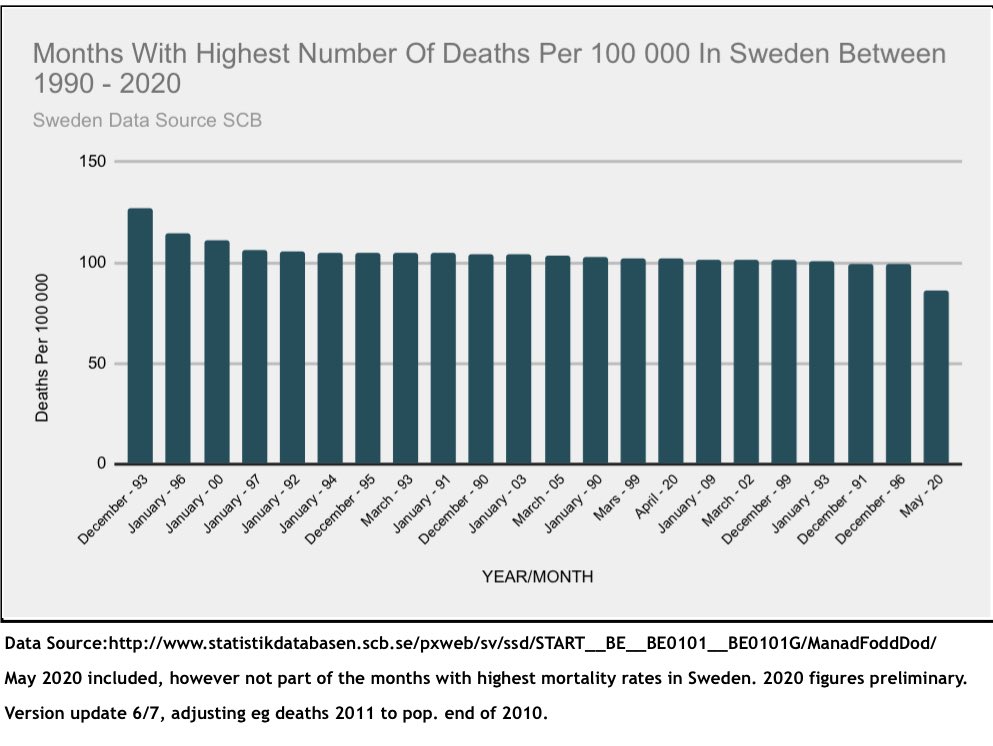
16/25 when looking at March through June and individual months we we that April is one of the months with highest mortality since 1990 but still not unprecedented. Although one could argue that we have as of late been accustomed to a different reality+
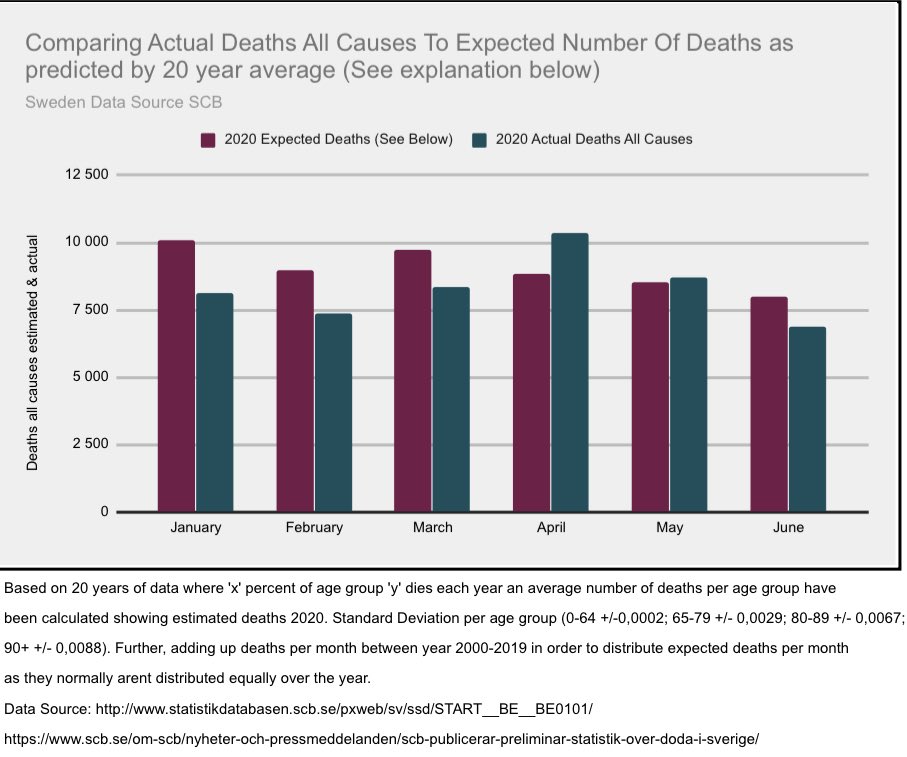
17/25 we can also experiment with expected deaths based on average and trend. First looking at average it would look like this+ #COVIDー19
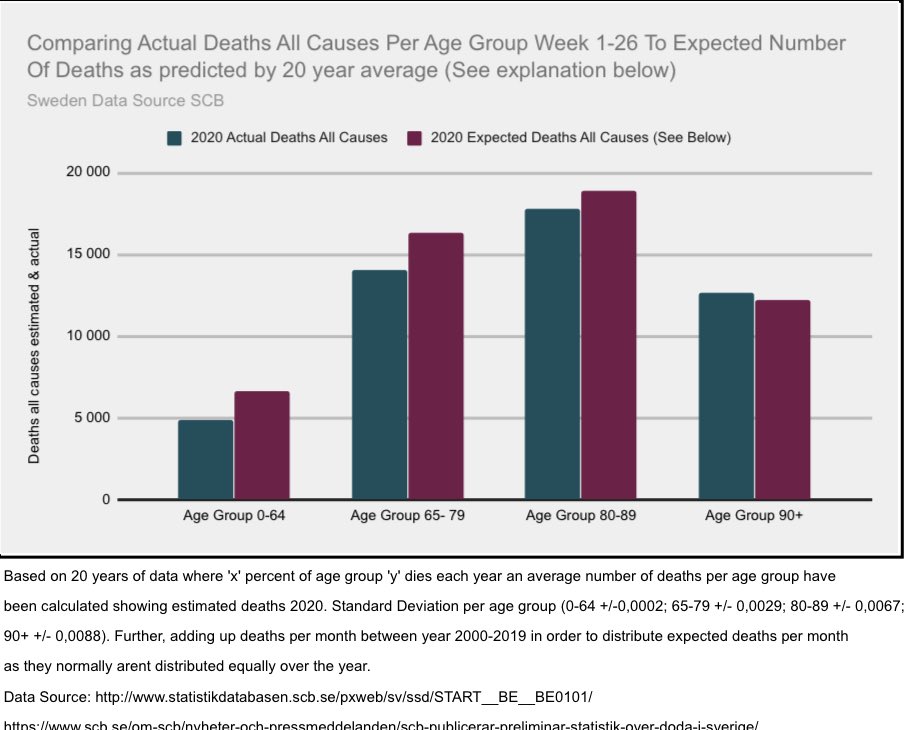
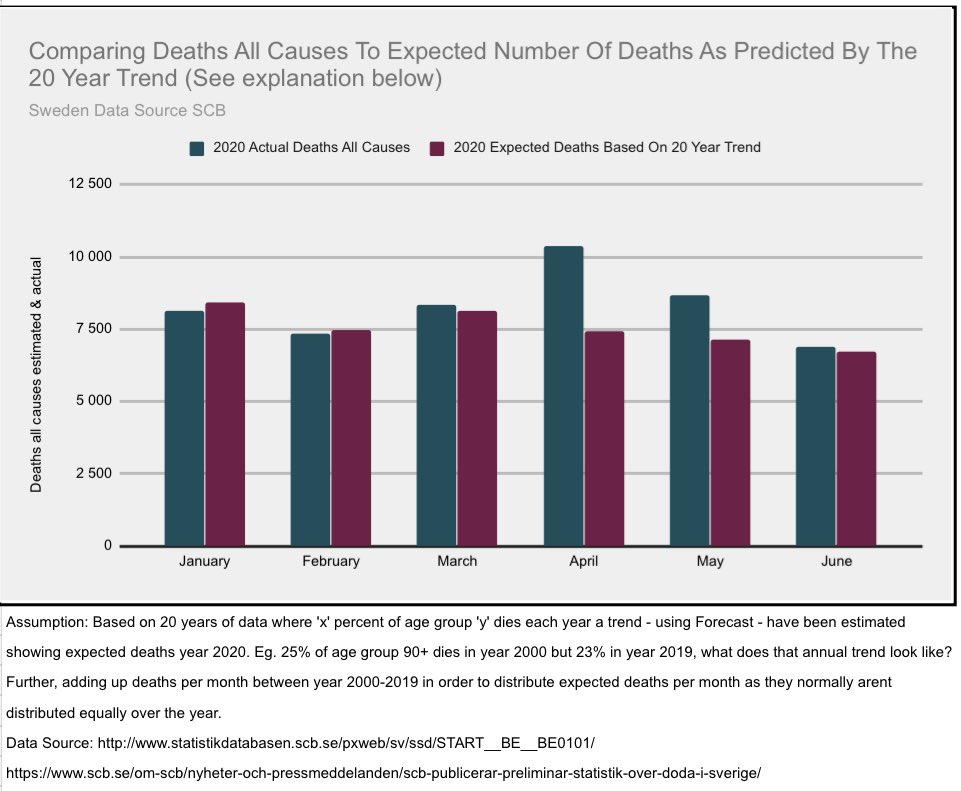
18/25 and than looking at trend it would look like this, hence not a lot above average but breaking with downward trend+ #COVID19sverige
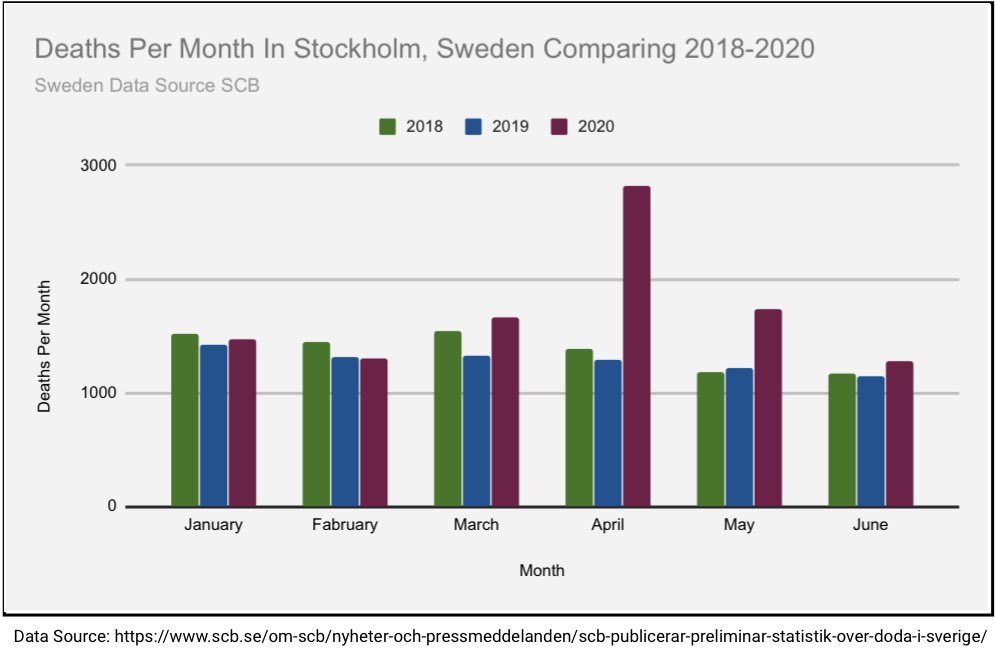
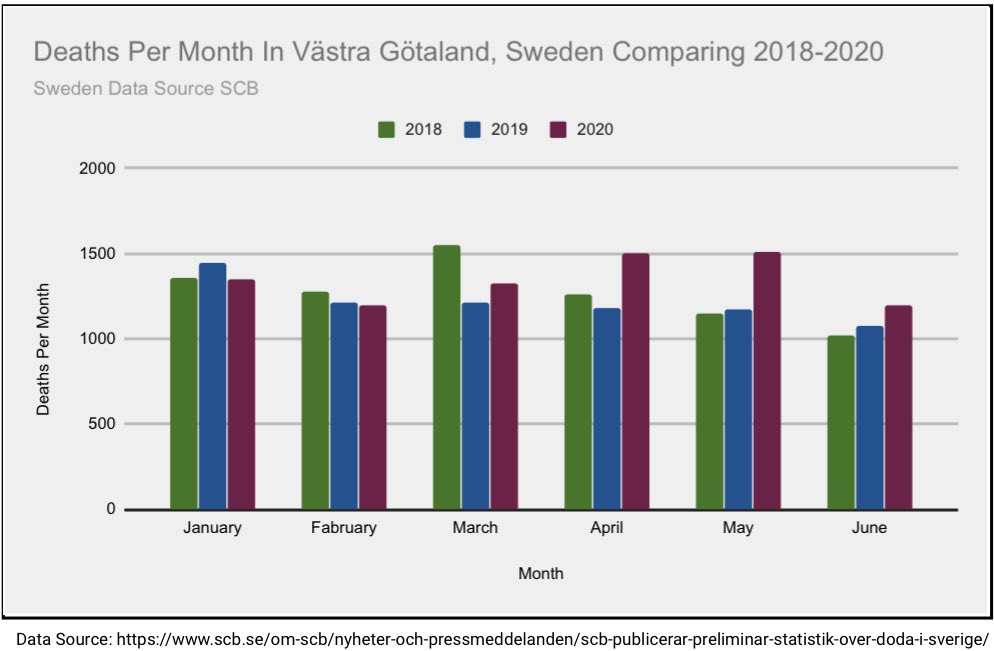
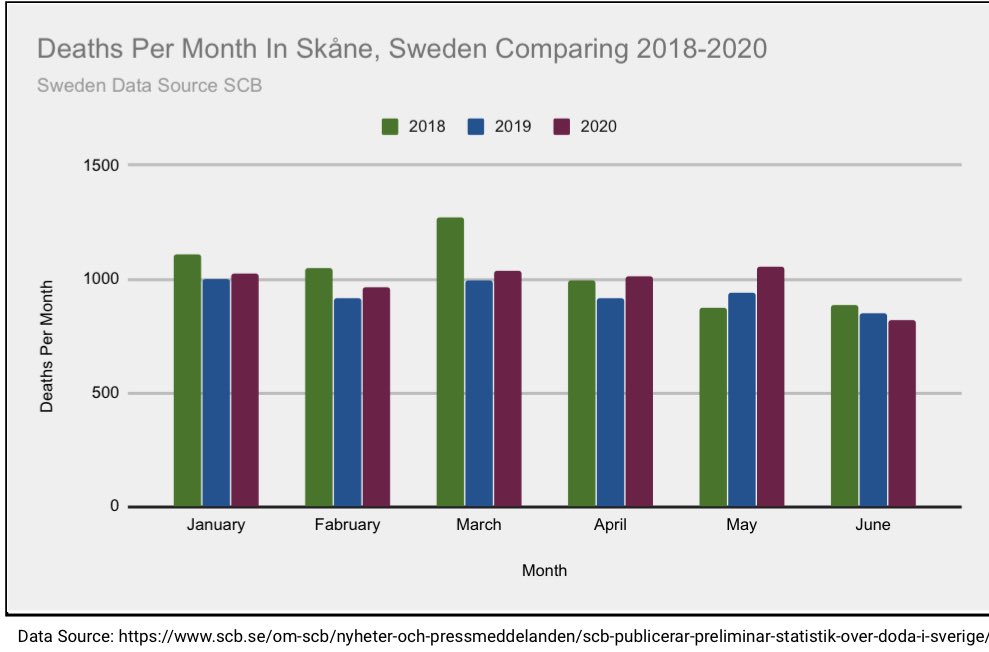
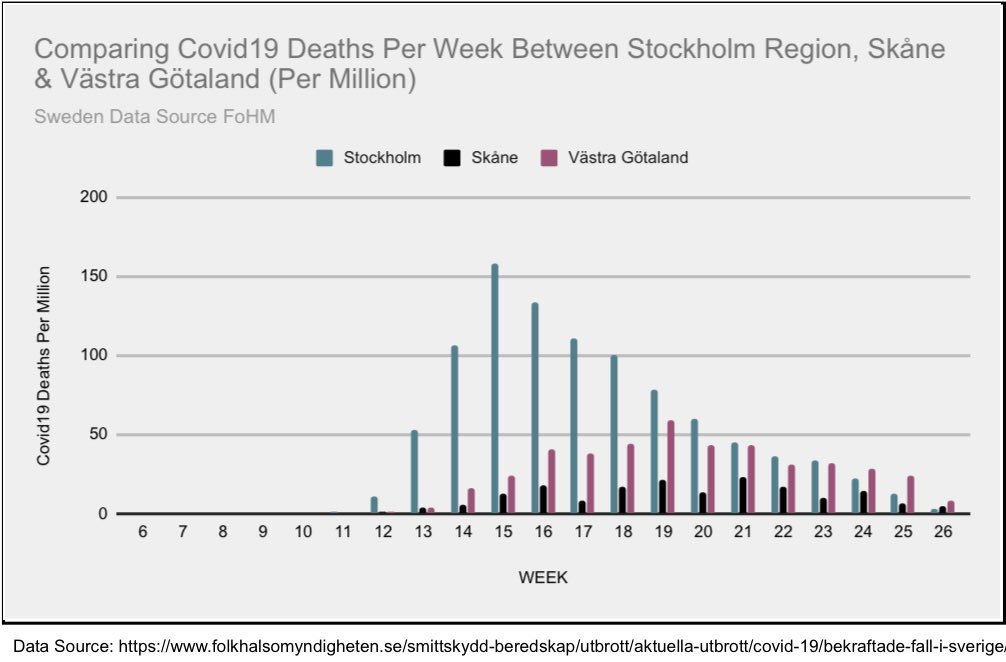
19/25 what has been apparent is how the impact have had different severity in different regions, here comparing, Stockholm, Skåne & Västra Götaland. And we see that Stockholm has ca 43% of all #covid19 deaths. Skåne, neighbouring with Denmark, has few deaths.+ #COVID19sverige
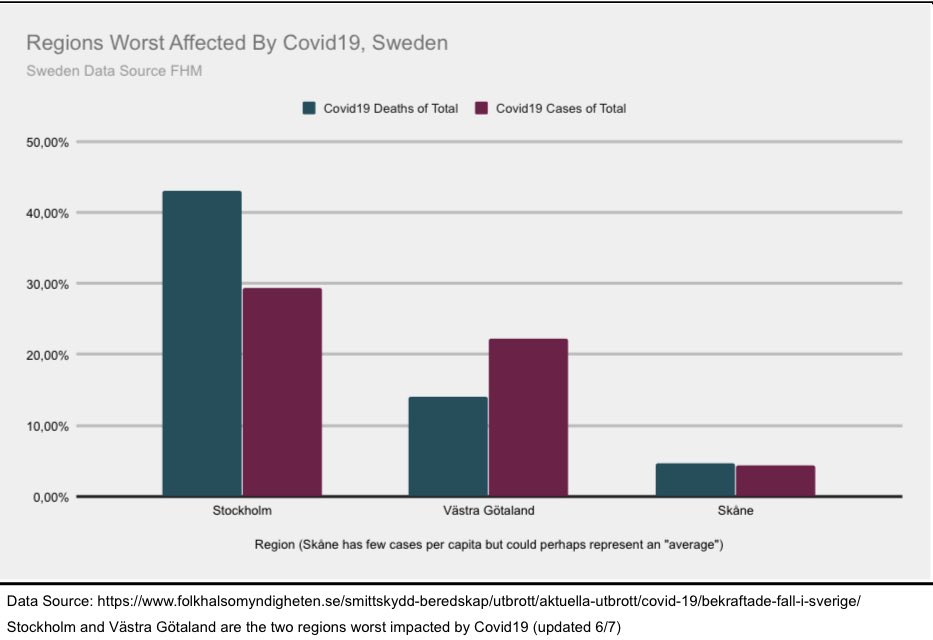
20/25 this does not mean other regions have no spread of virus, seroprevalence shows they had spread as well, although less than Stockholm but Skåne has seen no higher mortality than previous year, Stockholm has+ #covid19
21/25 But we can also see that #covid19 deaths are declining in all compared regions+
22/25 Back to the whole country, when comparing excess deaths as the difference to prior 5 year average last ca 100 years would look like this (all of Sweden), one has to understand the numbers and context behind the charts.+
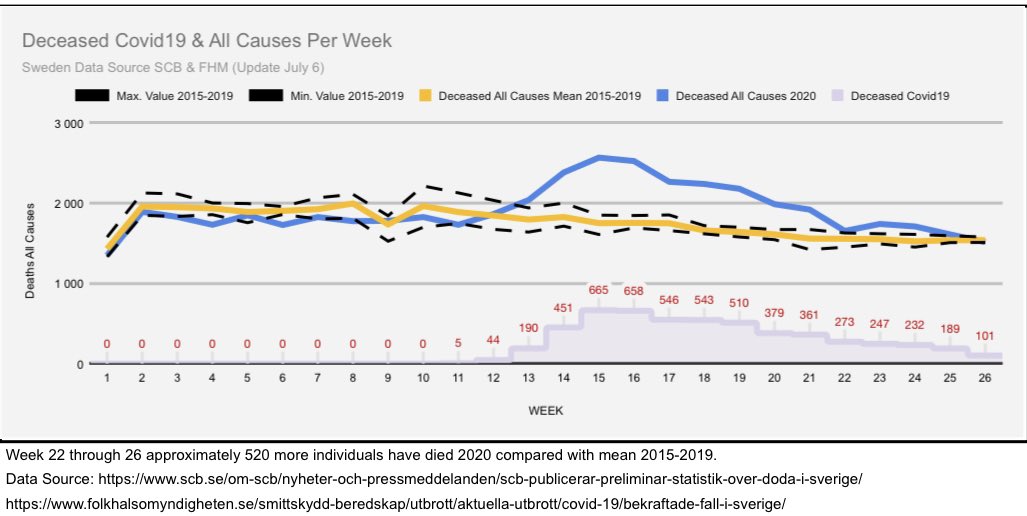
23/25 as can be seen here, peak at week 15 and now declining back to normal levels (slightly above) regarding #covid19 & deaths all causes.
24/25 that’s it from this update. inspiring acc. @MLevitt_NP2013 @ProfKarolSikora @FatEmperor @FrankfurtZack @boriquagato @ClarkeMicah @AlistairHaimes @CoronaPogue @kerpen @EffectsFacts @EthicalSkeptic @oliverbeige @TTBikeFit @TLennhamn @Zippo88lrr @MarkChangizi + many others+
25/25 and whatever we collectively do in the future, let’s not go strict lockdown as some countries have done putting the whole world through this ordeal at high costs, not only purely economical costs/END #COVIDー19 PS. Let me know if question or anything I’ve missed👍🏽
This entire thread is now in blog format as well …edevelopmentperestroika.wordpress.com/2020/07/07/gue… using @TLennhamn existing blog.