My Authors
Read all threads
Thread: Stochastic Indicator

#Stochastic #Indicators #Definedge
If we merge last 5 candles and make one. Highest high of last sessions is High of this merged candle, Lowest Low is a Low price of this candle and recent closing price is a close of this merged candle.
Let’s calculate range of this candle.

Range = High – Low

For example, High of this merged candle is 100 and Low is 80. So, the range is 40.

Range of this candle shows, the price range of last five sessions.
What if we calculate Close - Low of this merged candle, what will it show?

It would capture how far the closing price is from the lowest price of last five sessions – right?

Let us call it CL.

In above example, closing price is 100 and Low is 80 so CL is 20.
If the value of CL is a big number, it is a bullish sign, indicating price is closing way higher from the low.
Similarly, if CL is a small number, it is bearish. See the image.
But how do we know whether it is high or low just from the absolute number? We can get to know that if we divide this by range – Let’s call it K.

So in the earlier Example, CL is 20 and range is 40: K is 50%. (20 / 40 x 100).

K shows us how strong or weak the CL is.
If CL is 30 and range is 40, K is 75%. This is bullish because current price is near the high of the last 5 sessions. It is going up.

If CL is 10 and range is 40, K is 25%. This is bearish because current price is near the low of last 5 sessions.

Got it?
This way, we can calculate CL and Range every day.

George Lane developed Stochastic indicator during late 1950s.

If Stochastic parameter are 5, 3, 3:
CL and Range is calculated over last 5 bars.
Average of CL and Range is calculated over last 3 bars.
%K = (Average of CL) / (Average of Range)
%D = 3-bar average of %K.

Simple average method is used in all calculations. Stochastic indicator oscillates between 0 and 100.
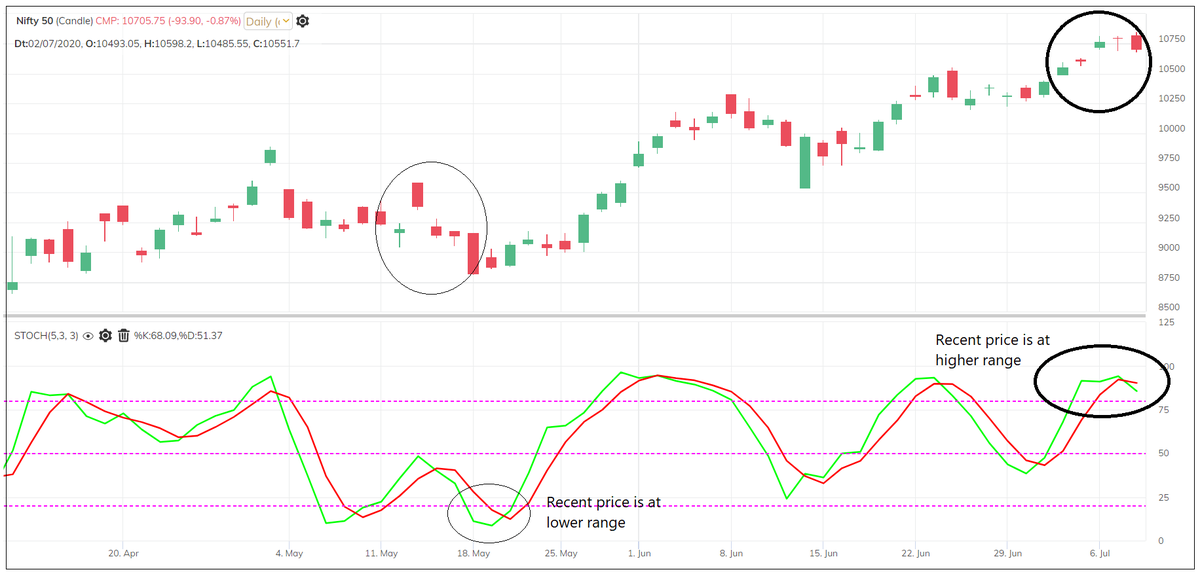
See this image. It is 5,3,3 Stochastics. When Stochastic indicator is at upper range – it shows that recent price is at the upper range of last 5 candles. If stochastic indicator is at lower range – it shows that recent price is at lower range of last 5 candles.
Stochastics shows momentum of price.

Bullish momentum = price is near its high in a given time period
Bearish momentum = price is near its low in a given time period
Stochastics above 50% shows that current price is above the mid-range price.

So, Rising Stochastics and above 50% indicate bullish momentum and falling Stochastics below 50% indicate bearish momentum.

5,3,3 and 14,3,3 are popular parameters.
There are many ways to trade Stochastics. But I think to keep it simple:
Stochastics above 50% and %K above % D = Bullish
Stochastics below 50% and %K below %D = Bearish.
Remember, unlike RSI and many other indicators – Stochastics considers High and Low in the calculation. It is important to note this distinction. We should learn what is the characteristics of the indicator. It will help us in the long run.
The application of these indicators on Noiseless charts is interesting. We cannot use all these indicators but knowing them well helps a lot in understanding the price patterns. It is not necessary to plot indicators in charts to read them when you have understood the principle.
Missing some Tweet in this thread? You can try to force a refresh.

Keep Current with Prashant Shah

Profile picture

Stay in touch and get notified when new unrolls are available from this author!

Read all threads

This Thread may be Removed Anytime!

Twitter may remove this content at anytime, convert it as a PDF, save and print for later use!

Try unrolling a thread yourself!

how to unroll video

1) Follow Thread Reader App on Twitter so you can easily mention us!

2) Go to a Twitter thread (series of Tweets by the same owner) and mention us with a keyword "unroll" @threadreaderapp unroll

You can practice here first or read more on our help page!

Follow Us on Twitter!

Did Thread Reader help you today?

Support us! We are indie developers!


This site is made by just two indie developers on a laptop doing marketing, support and development! Read more about the story.

Become a Premium Member ($3.00/month or $30.00/year) and get exclusive features!

Become Premium

Too expensive? Make a small donation by buying us coffee ($5) or help with server cost ($10)

Donate via Paypal Become our Patreon

Thank you for your support!