Nicolas Darvas (1920 – 1977) was a professional dancer and he travelled around the world. He founded a Dance company in 1950s. Someone offered him shares against his Dance programme and that is how he came across stock market and the business of trading.
He reportedly turned thousand dollars into millions in the late 1950s.
He wrote a popular book during 1960 “How I made $2000000 in Stock Market” in which he explained his Box theory. It is a must read.
He used a combination fundamental and technical approach for investing.
He wrote a popular book during 1960 “How I made $2000000 in Stock Market” in which he explained his Box theory. It is a must read.
He used a combination fundamental and technical approach for investing.
He believed in investing in only growth stocks. I think he did not explain a few things in his book, and I found some difference in interpretation of box-theory at various places because of that. This post is my interpretation of his theory.
Darvas was tracking stocks only making new high. I do not think he really talked about 52-week high. He mentioned about stocks breaking 2-3 year high. But 52-week high is mostly tracked for this theory so let us keep it that way to begin with for the sake of objectivity.
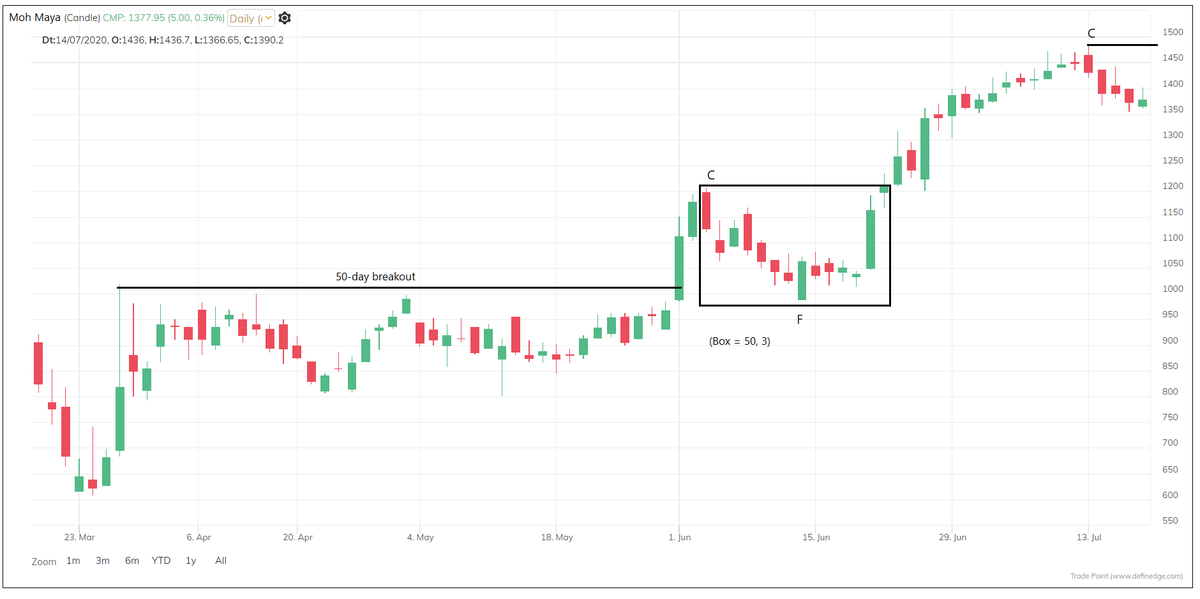
But since we are tracking it on daily chart, I converted 52-week to daily (Roughly, we would have 250 candles in a year). So, first step is a stock making 250-day high. Stock should report higher volumes. He emphasised a lot on Volume. 
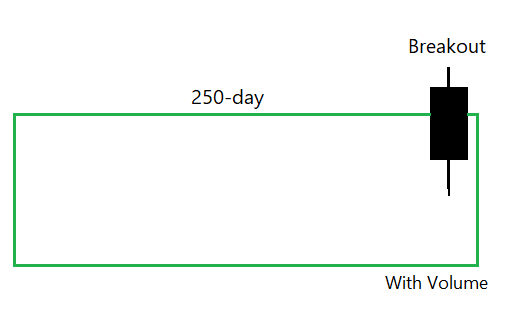
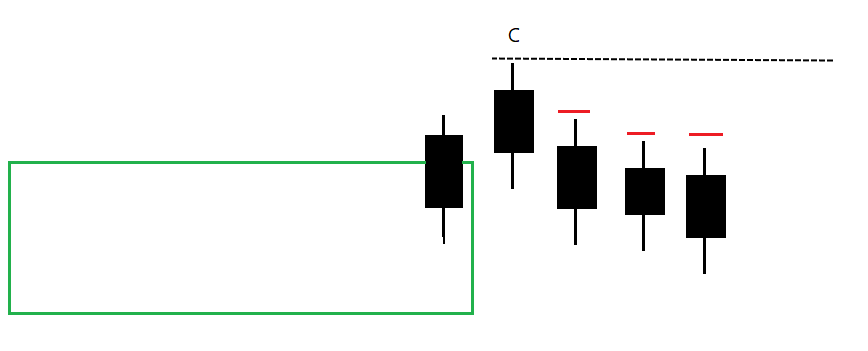
Once the new high is marked, wait for three candles followed by that high that does not cross the high. If that happens, let us mark the unbroken high as C.
Check the image below for details.
Check the image below for details.
Once the C is in place, look for F. F is Low of the candle which does not get broken for next 3 sessions. If that happens, F gets marked at unbroken low.
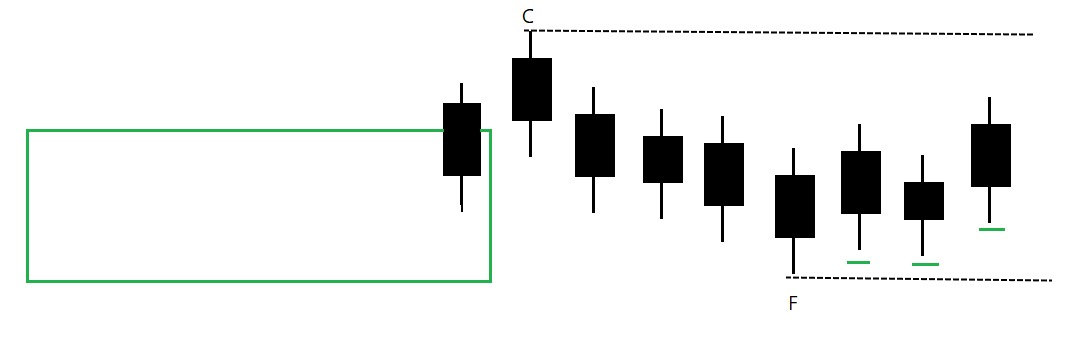
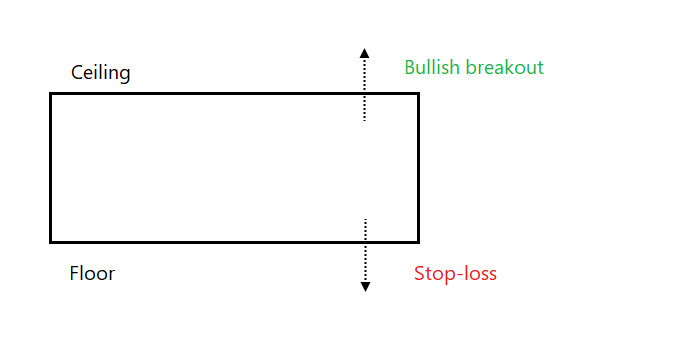
Now we have a box. C is Ceiling of the box and F is floor of the box.
If price closes above C – it is a Darvas Box breakout and a buy point. Stop should be placed below F.
If price closes above C – it is a Darvas Box breakout and a buy point. Stop should be placed below F.
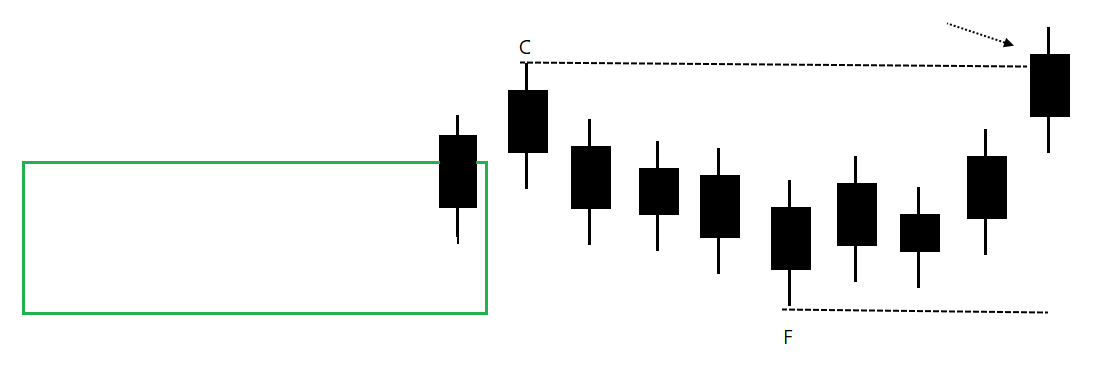
Understood how Darvas box is formed? Buy if price closes above Ceiling and put a stop-loss below Floor price.
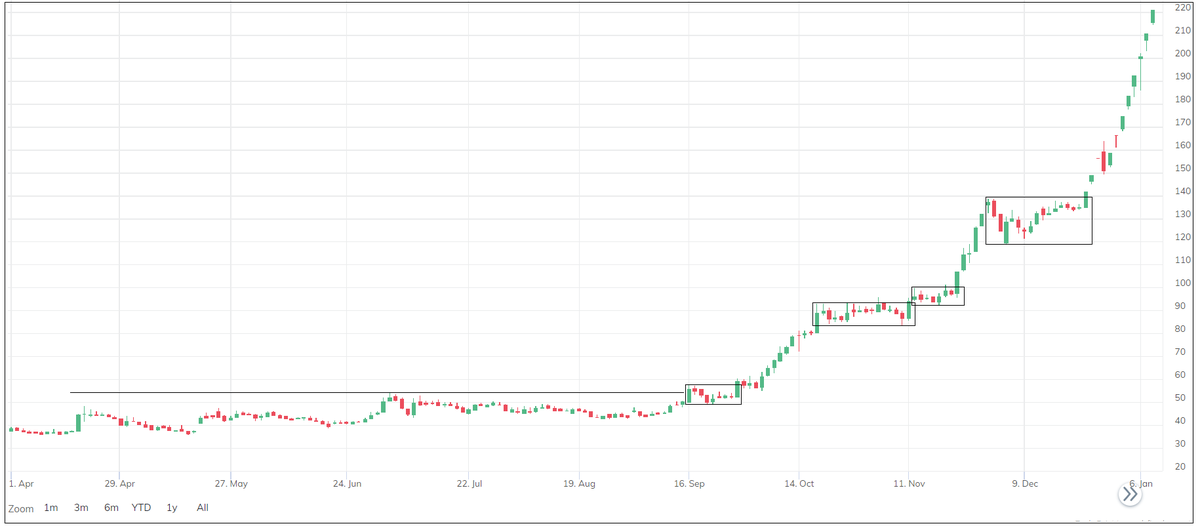
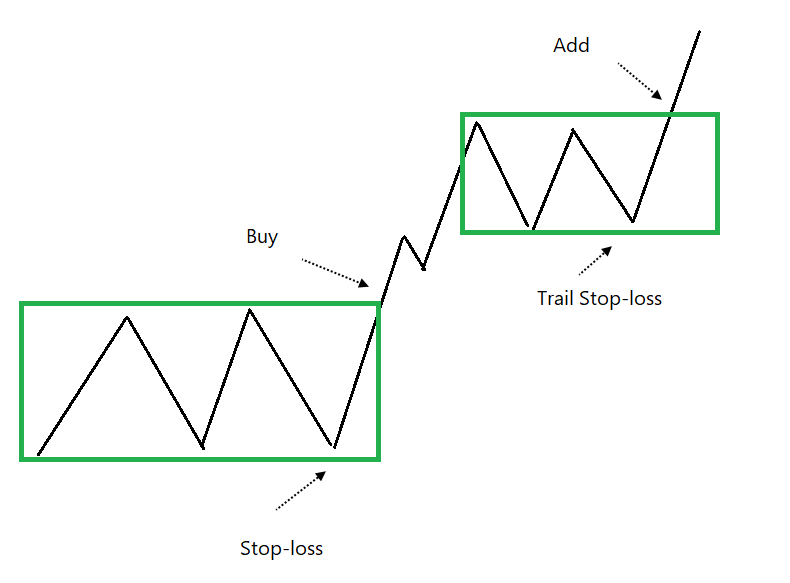
Darvas followed a Pilot buying method. He would generally make a small pilot buy and add to winners. He believed in pyramiding or adding more on subsequent breakouts.
Darvas followed a Pilot buying method. He would generally make a small pilot buy and add to winners. He believed in pyramiding or adding more on subsequent breakouts.
After the breakout of the box, if price moves higher and forms another box, then trail stop-loss to the Floor price of the newly formed box and keep trailing on each subsequent floor. Exit the trade when price goes below the floor price of the recent box.
I used 250-day on daily chart instead of 52-week on weekly chart because Darvas said 3-day retracement in his book. He called himself mental chartist as he was not using the charts. So, he was observing a new high in numbers, drawing virtual box from observations of prices and -
-followed a 3-day rule. Nonetheless, one can use it on weekly or any other timeframe.
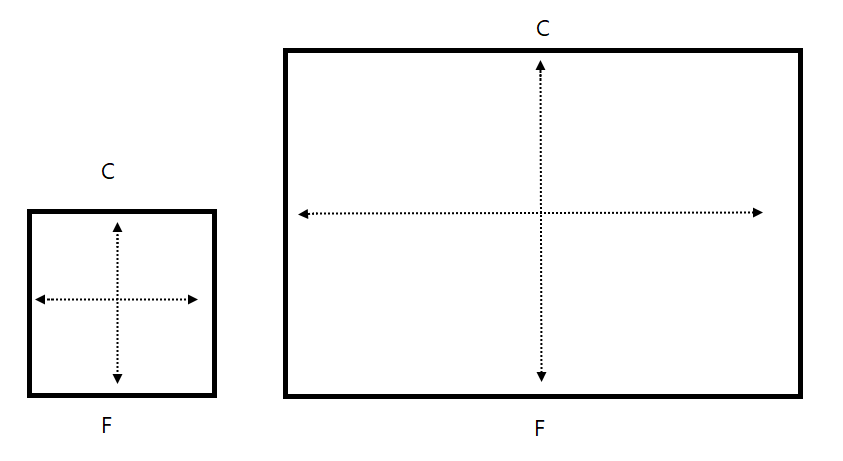
There are no rules for height and width of the box. Meaning, stock can remain for any number of days within the box after forming the C. The stop can be far if distance between C & F is more.
There are no rules for height and width of the box. Meaning, stock can remain for any number of days within the box after forming the C. The stop can be far if distance between C & F is more.
So, it is a trend following strategy. Buy on a breakout, ride the winners, trail the stop-loss. Strategy is expected to perform well during strong trends.
Height of the box can tell us how far the initial stop is.
Height of the box can tell us how far the initial stop is.

His method:
>Buy companies whose growth & earnings prospects look highly promising
>Check overall market trend to ascertain whether stocks in general are in an uptrend
>Check whether stock belongs to the strong industry or group
>The price breakout is backed by higher volume
>Buy companies whose growth & earnings prospects look highly promising
>Check overall market trend to ascertain whether stocks in general are in an uptrend
>Check whether stock belongs to the strong industry or group
>The price breakout is backed by higher volume
I would call it GERUV (Growth, Earning, RS, Uptrend, Volume)
He had his own share of a bad phase in trading career. At
one point of time, he lost $100000 in a matter of month. But he was a quick learner and an intelligent guy.
He had his own share of a bad phase in trading career. At
one point of time, he lost $100000 in a matter of month. But he was a quick learner and an intelligent guy.
He said, “I have no ego in the stock market. If I make a mistake, I admit it immediately and get out fast.”
He explains in the book the lessons that he learned after
that huge loss. He said he realised that “his ears were his enemy”!
He explains in the book the lessons that he learned after
that huge loss. He said he realised that “his ears were his enemy”!
I liked how he drew analogy from his profession of Dancing to trading.
He said, before a dancer leaps into the air he goes into a crouch to set himself for the spring. Stocks behave same way after the breakout.
He said, before a dancer leaps into the air he goes into a crouch to set himself for the spring. Stocks behave same way after the breakout.
For booking profits he said, a producer would be a fool to close the show when he see the theatre full every night. It is only when he starts to notice empty seats that he considers closing the show. I would be fool to sell a stock as long as it keeps advancing.
I'd call it 250, 3 box on daily charts. We can use this theory on any timeframe with same or different settings. Darvas was an investor, he did not think about new low breakout for short selling. A bearish box below new low can be created. Rules for height of the box? Why not.
He learned that there is one thing to be a consistent winner: Your wins should be bigger than your losses. How things he realised in 1950s are valid even today! Generations will change, human psychology was same even 5,000 years ago. Basic premise of TA - history repeats itself!