Thread: Turtle Trading
Have you ever thought about this - Are good traders born that way or can someone be trained to become one?
Have you ever thought about this - Are good traders born that way or can someone be trained to become one?

During 1983, Richard Dennis - a successful & popular trader had an argument with his friend William Eckhardt about this subject - whether great traders are born or made
Richard: We can teach and create good traders
Eckhardt: No, there are certain aspects which cannot be taught
Richard: We can teach and create good traders
Eckhardt: No, there are certain aspects which cannot be taught
They decided to do an experiment. They published an advertisement in the newspaper that they will train a group of people in their proprietary system & also give them the capital to trade the system. Interested candidates can apply, experience in market was not necessary.
They got over 1,000 applications and 13 were finalized. They were from different backgrounds. They were trained for two-weeks in Chicago before they were given the money to trade.
The selected students were called the Turtles.
The selected students were called the Turtles.
Dennis said that they were going to grow traders like people grow turtles in Singapore. Their trading System known as Turtle trading system was an objective system having clear rules for everything – trading universe, Entry, Exit, Position sizing.
They were trading stocks, bonds, commodities, currencies, and many other markets. Liquidity was their important criteria due to the size they were trading.
There were two systems: System 1 and System 2.
Turtle Traders had option to decide allocation to these systems.
There were two systems: System 1 and System 2.
Turtle Traders had option to decide allocation to these systems.
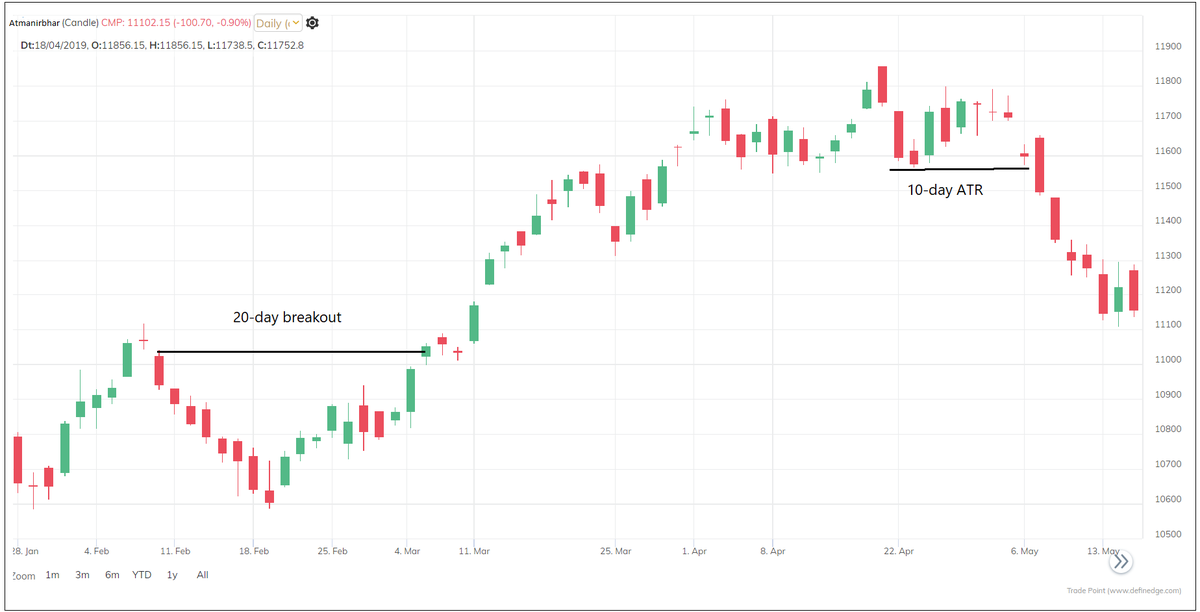
System 1:
Long: When price crosses 20-day high
Long Exit: If price falls below 10-day low
Short: When price falls below 20-day low
Short Exit: If price goes above 10-day high
Buy as soon as price qualifies for above criteria. Do not wait for the closing.
Long: When price crosses 20-day high
Long Exit: If price falls below 10-day low
Short: When price falls below 20-day low
Short Exit: If price goes above 10-day high
Buy as soon as price qualifies for above criteria. Do not wait for the closing.
There was a rule here. Irrespective of direction, Ignore the breakout if last trade was a winning trade - Last breakout whether you have traded it or not. So, it is not a rule for equity curve.
If breakout was missed because of this rule, then entry should be made on System 2.
If breakout was missed because of this rule, then entry should be made on System 2.
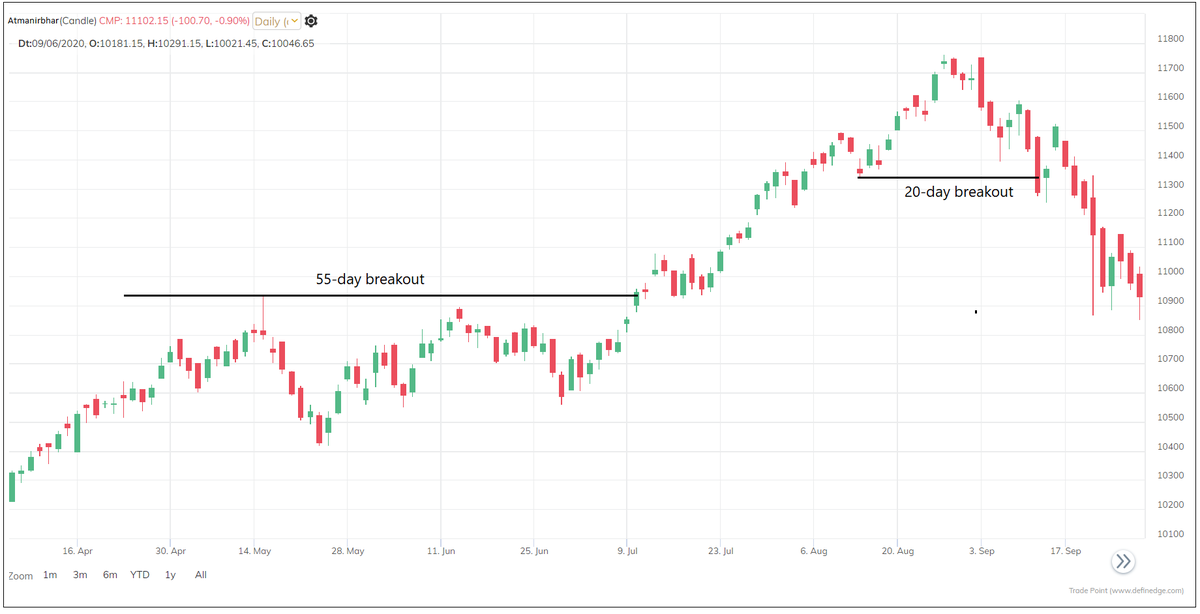
System 2:
Long: When price crosses 55-day high
Long Exit: If price falls below 20-day low
Short: When price falls below 55-day low
Short Exit: If price goes above 20-day high
For system 2, all breakout should be taken whether previous trade was a winner or not.
Long: When price crosses 55-day high
Long Exit: If price falls below 20-day low
Short: When price falls below 55-day low
Short Exit: If price goes above 20-day high
For system 2, all breakout should be taken whether previous trade was a winner or not.
Besides these exit rules, there was a rule for stop-loss for both systems.
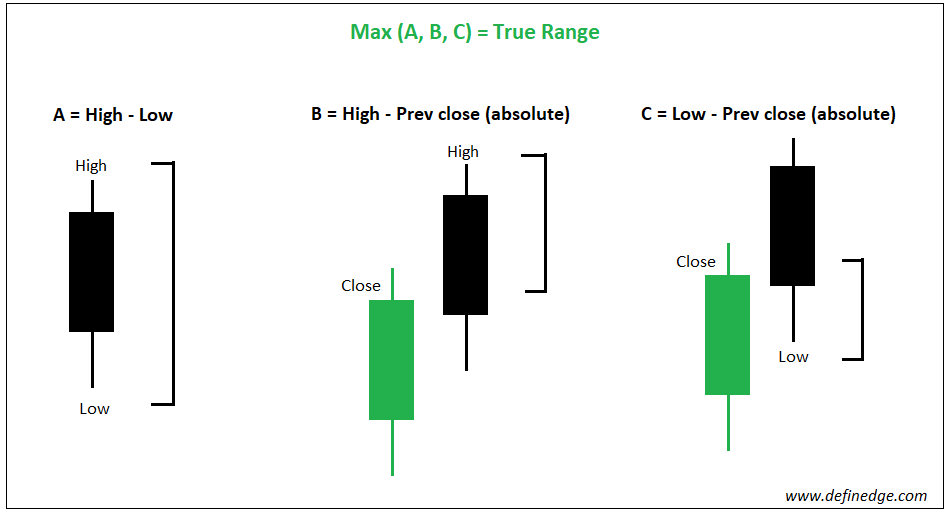
Stop-loss was twice of 20-day ATR (Average True Range) price.
So, stop-loss is 2-ATR below price for Long, 2-ATR above price for Short. I have explained ATR in earlier threads.
Stop-loss was twice of 20-day ATR (Average True Range) price.
So, stop-loss is 2-ATR below price for Long, 2-ATR above price for Short. I have explained ATR in earlier threads.
There was a rule for position sizing as well:
Maximum stop-loss should be 2% of total account size and quantity for the position will be decided accordingly.
Upon breakout, they would by 1 unit. What is 1 unit?
Maximum stop-loss should be 2% of total account size and quantity for the position will be decided accordingly.
Upon breakout, they would by 1 unit. What is 1 unit?
For example, account size is 10 lacs.
ATR is 100 points.
Stop-loss becomes 200 points (2-ATR).
Max loss is 2% of account size = 20,000.
1 unit = 100 qty (20,000 / 200).
If you are trading in futures, divide it by lot size to know number of lots to be traded.
ATR is 100 points.
Stop-loss becomes 200 points (2-ATR).
Max loss is 2% of account size = 20,000.
1 unit = 100 qty (20,000 / 200).
If you are trading in futures, divide it by lot size to know number of lots to be traded.
Turtles were using method of pyramiding – adding to winners. 1 unit to be added at every ½ of ATR move in favor, and there will be a rule for max units to be added to a position depending on the market they were trading.
Eg, if Nifty gives breakout and ATR is 100.
Buy 1 unit with stop-loss of 200 points. And add 1 unit at every 50-point move. Stop-loss of all quantities would be 2-ATR away from recent entry.
They were trading diversified portfolio.
Buy 1 unit with stop-loss of 200 points. And add 1 unit at every 50-point move. Stop-loss of all quantities would be 2-ATR away from recent entry.
They were trading diversified portfolio.
There were rules for Maximum units based on correlated, non-correlated, single market or based on direction and they played a key role in saving them from highly volatile or unfavourable days. There were rules for cutting the positions and risk during drawdown.
Rules are clear, so a trader would always know his buy – sell or exit price, right?
Though rules look simple today, the concepts like Volatility based stop & position sizing were very advanced then. Turtles traded huge money based on this rule-based system.
Though rules look simple today, the concepts like Volatility based stop & position sizing were very advanced then. Turtles traded huge money based on this rule-based system.
Many Turtle traders went on to become successful traders and money managers.
There is much more to know about this system and the journey of turtle for which these books are must read. The Complete Turtle Trader by Michael Covel & Way of the Turtle by Curtis Faith
There is much more to know about this system and the journey of turtle for which these books are must read. The Complete Turtle Trader by Michael Covel & Way of the Turtle by Curtis Faith
Don't focus on parameters of the system. I would always recommend focusing on principle rather than the parameter of systems.
What was important thing about it: Objective systems, Rule-based, Range breakout-Trend following, Pyramiding, Clear Entry – exit & position sizing rules
What was important thing about it: Objective systems, Rule-based, Range breakout-Trend following, Pyramiding, Clear Entry – exit & position sizing rules
Methods evolve. Any trend following system would have low or moderate hit ratio but the risk-reward ratio will be high. Sideways, volatile mkt is a non-favourable phase.
There will be some big winners that will make the business successful. But execution is easier said than done
There will be some big winners that will make the business successful. But execution is easier said than done
I feel it is true even for fundamental investing. Not all stocks that you hold in long-term would prove rewarding. There will be some huge winners which will make the portfolio profitable. Their RR makes them successful. Downtrend, long consolidation is a non-favourable phase.
I have framed the rules for trading Turtle in P&F charts.
Story of turtle is one of its kind in the history of this business. It was an important experiment that teaches us many things. Richard Dennis and William Eckhardt were brilliant traders and ahead of their time.
Story of turtle is one of its kind in the history of this business. It was an important experiment that teaches us many things. Richard Dennis and William Eckhardt were brilliant traders and ahead of their time.
This statement says it all:
“I always say that you would publish my trading rules in the newspaper, and no one would follow them. They key is consistency and discipline.” – Richard Dennis
“I always say that you would publish my trading rules in the newspaper, and no one would follow them. They key is consistency and discipline.” – Richard Dennis
• • •
Missing some Tweet in this thread? You can try to
force a refresh