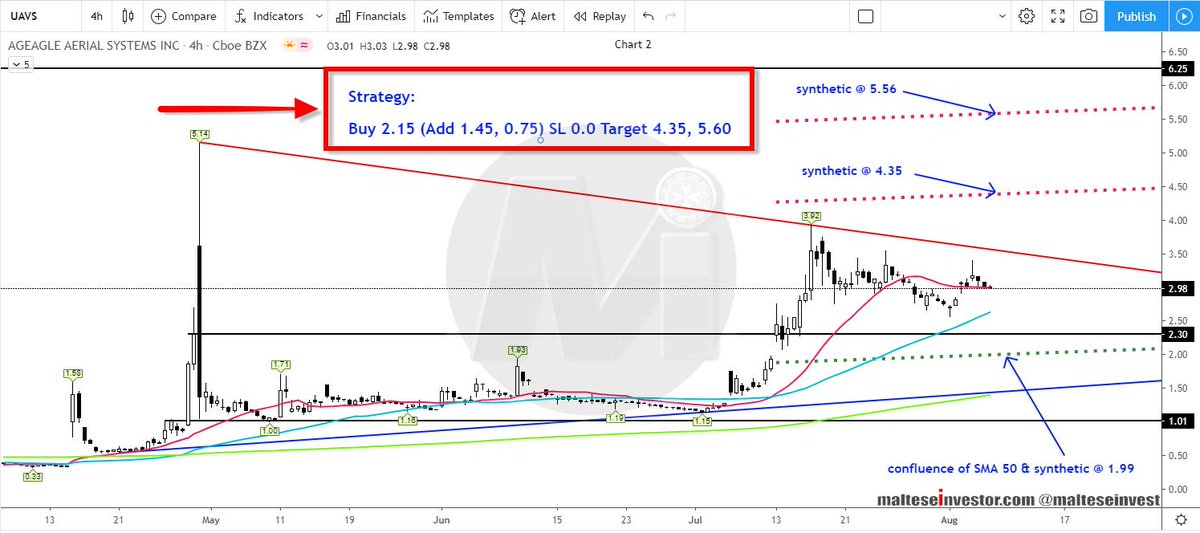
Daily Chart: Ever since April's kneejerk move, price remains contained in a triangle with falling #momentum. Price needs to close above #trendline resistance at 3.55 and then hold above 4.35 to target 5.57, further up .....
UAVS 2/4
UAVS 3/4
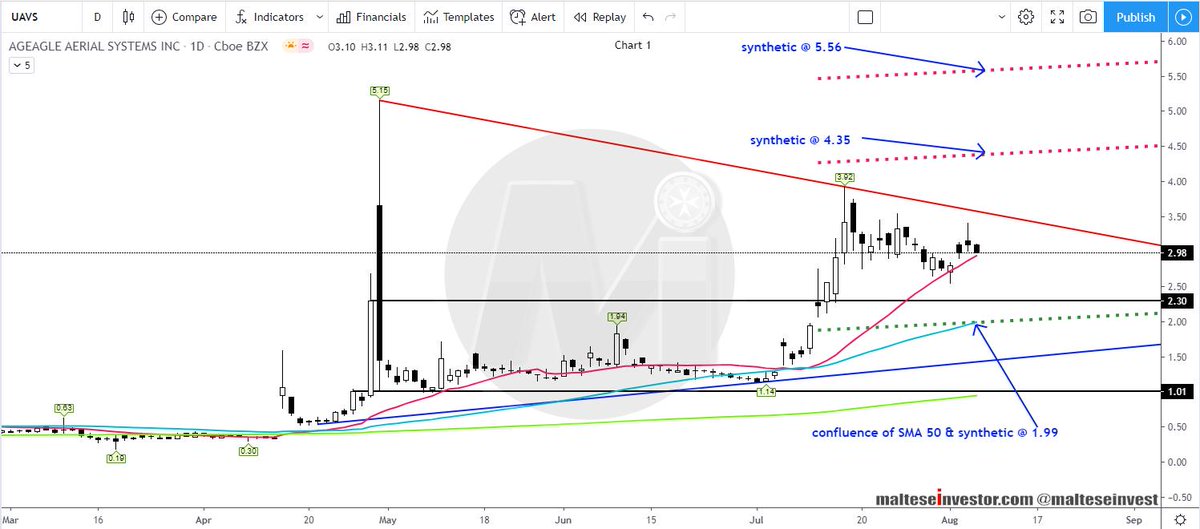
4 Hour Chart: The SMA 200 currently at 1.40 has been supporting the up move since Apr. 2020.
The #Strategy is printed on the image.
$UAVS 4/4
