My Authors
Read all threads
Is herd immunity now high enough to contribute to reduced transmission of #COVID19?

Thread from @trvrb is provoking substantial discussion as it should. I'd like to add a few details that aren't included.
Background
For diseases that induce immunity, transmission wanes as fraction of population gets infected & recovered because infected people mostly contact immune people. At a certain level (the herd immunity threshold, HIT) cases shift from growing (Rt>1) to shrinking (Rt<1).
HIT has been huge topic of recent discussion, in large part b/c of uncertainty of what HIT is for #COVID19:

tl;dr HIT based on simple models (if R0=2.5, HIT=1-1/R0=60%) are too high but by how much isn't clear.
Two months ago seroprevalence in most places in the US (not NYC) were so low (<10%; most <5%) that everyone (ok, almost everyone) agreed we were so far from HIT that immunity was mostly unimportant. See
But w/ transmission continuing steadily for months, fraction infected is now certainly higher. Could it now be high enough to reduce transmission substantially? Could it stop rise in cases? (make Rt<1)
Yes, if:
1) seroprev is >10%
2) Rt (# cases/case) was <2 due to beh. change
or
3) heterogeneity in contact/suscept/infectiousness is so large that HIT is much lower than we thought (i.e. is actually 10% rather than 30-60% assuming Rt = 2.5)

Before assessing data for each let's remember, as @trvb nicely described, that COMBINATION of these can drive Rt<1
But let's also remember to look at correct spatial scale (that plus heterogeneity are 2 key aspects @trvrb didn't discuss). Transmission doesn't happen at state scale. It happens primarily w/in cities & even neighborhoods. State level data can mislead.

On to the data!
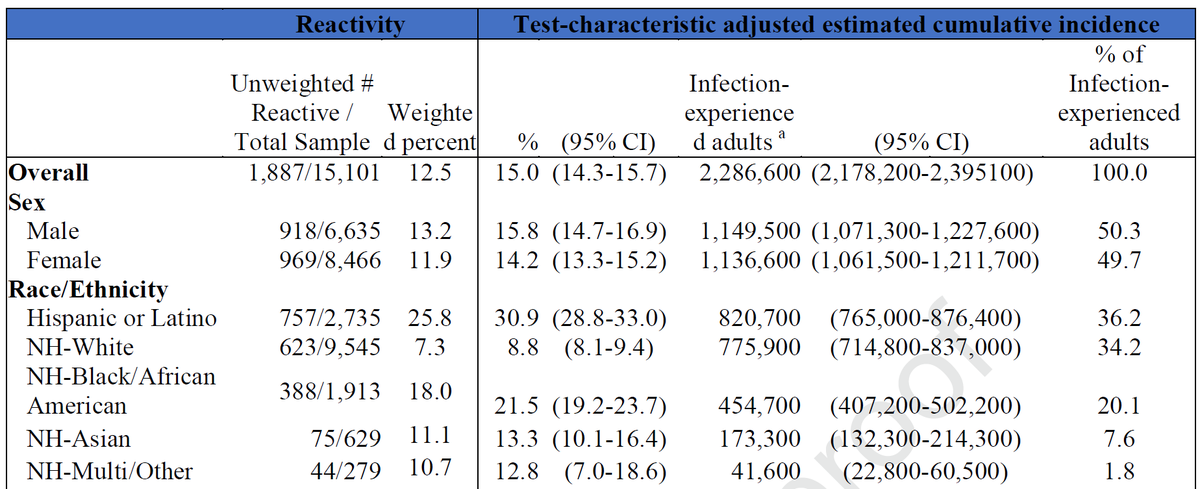
#3 HIT = 10%: Easy. Clearly false. Clear data showing seroprev >20% for whole huge pop (NYC: sciencedirect.com/science/articl…).

Even w/ overshoot would need R0>>2.5 to get NYC seroprev if HIT=10%.
Lockdown is much more likely explanation for stop in NYC epidemic.
2) Rt<2 due to behavioural change
Data: Very plausible. Rise in cases post-lockdown in most states has been nowhere near as fast as the rise in March. As @trvrb points out Rt estimates are much lower. epiforecasts.io/covid/posts/na…
(much better source than rt.live)
That is great! That means social distancing & lockdowns work (directly or indirectly: ). As @trvrb points out lockdowns have huge cost, so we need to be able to reduce Rt from 2.5 to 1.5 w/out shutting economy & schools. Not clear if that's possible yet.
2) Seroprevalence >10%
Data: Uncertain.
@trvrb & others @youyanggu use back of envelope multipliers of cases to get estimates of # of infections & then divide by pop to get seroprev or frac infected. Early in epidemic we all guessed & used 10x. @trvrb uses 8x. Is it right?
Very tough to say since huge changes in testing capacity over time; real multiplier has probably changed from 20-50x to 3-10x depending on place & time. So I think it's a bit dangerous to use single multipliers like this.
If we had sequential seroprev estimates we could know.
They are possible & have been done (Switzerland below)! We should be doing these in all hard hit states. Even small #s w/ decent randomization would be extremely informative.
thelancet.com/journals/lance…
All seroprev studies in US I've seen were done so long ago & most only once (or were so non-representative as to be nearly useless: ) that they don't help know seroprev now in places it matters. @nataliexdean says some happened in FL but results?
Without data I think we need to explore range of multipliers AND consider spatial variation. @trvrb used 8x & thus suggested that 20% of FL had been infected. We can look at more local data & get better understanding.
In Miami-Dade county 127K cases; pop=2.72M. If infections = 5x cases this would give 23.4%. 8x would give 37.5%.
These are high numbers. So high, in fact that a very small serosurvey could accurately characterize seroprevalence & distinguish b/w them (& from lower #s like 10%).
But other counties of FL have much lower # cases/pop so if multiplier is same (assumes testing criteria & capacity are similar) that would mean immunity might be contributing to lower transmission in some places but not in others. This is very important for statewide policies.
Lifting measures uniformly across state would result in less rise in Rt in hard-hit places than others if substantial part of drop in Rt is due to spatially variable seroprevalence.
B/c I can't KNOW whether 5x or 8x (or 12x) is correct w/out seroprevalence data & it's essentially certain that seroprev varies spatially, I think it's problematic to make strong claims that 20% of FL has been infected & that is key contributor for Rt<1 statewide.
So I don't think FL should lift social distancing rules (e.g. allow indoor gatherings, open bars, stop wearing masks)
But I think it'd be very good to use @trvrb 's simple calculations to argue it's important to measure seroprev across FL repeatedly.
But unless seroprev is v high, most important thing is that Rt is function of human behavior. Rt was <1.5 when seroprev was likely <5%, so if we change behavior (more social gatherings, close contact w/ other households) Rt will increase & even w/ higher seroprev will be >>1.
That will lead to spike in cases, more lockdown, & disaster. I've written about that here:


So, meet outside, give space, & wear a mask!
Addition: heterogeneity in contact rates (proposed as a key component of why HIT would be lower than simple model assumption) themselves change with social distancing. Specifically, working from home reduces contact rates while essential workers can't do this.
Everyone returning to work both increases total contact rates & reduces variation in contact rates so has a double effect in increasing Rt & HIT. So beware of estimates of HIT derived from contact rates under social distancing.
Missing some Tweet in this thread? You can try to force a refresh.

Keep Current with A Marm Kilpatrick

Profile picture

Stay in touch and get notified when new unrolls are available from this author!

Read all threads

This Thread may be Removed Anytime!

Twitter may remove this content at anytime, convert it as a PDF, save and print for later use!

Try unrolling a thread yourself!

how to unroll video

1) Follow Thread Reader App on Twitter so you can easily mention us!

2) Go to a Twitter thread (series of Tweets by the same owner) and mention us with a keyword "unroll" @threadreaderapp unroll

You can practice here first or read more on our help page!

Follow Us on Twitter!

Did Thread Reader help you today?

Support us! We are indie developers!


This site is made by just two indie developers on a laptop doing marketing, support and development! Read more about the story.

Become a Premium Member ($3.00/month or $30.00/year) and get exclusive features!

Become Premium

Too expensive? Make a small donation by buying us coffee ($5) or help with server cost ($10)

Donate via Paypal Become our Patreon

Thank you for your support!