More updates on below 103 stocks total short interest after the close.
for July 15 reporting.
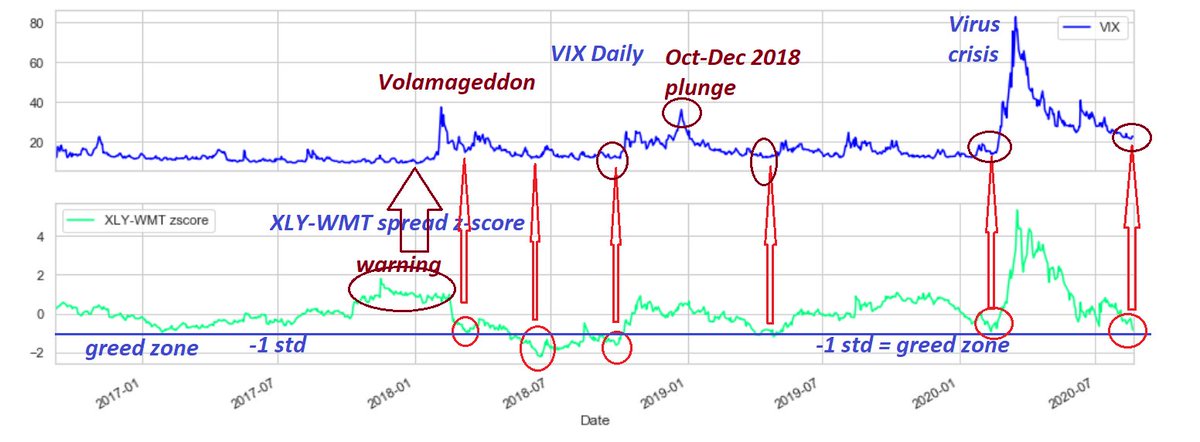
A great contrarian indicator for stocks.
for July 15 reporting.
A great contrarian indicator for stocks.
https://twitter.com/kerberos007/status/1283071925342875650
TSLA short interest as of July 15
total capitulation from the TSLA shorts:
from 6.5 short ratio last year to 1 (short ratio) days to cover
from almost 40 million shares short last year this time to 12 million shares short. 🧐
total capitulation from the TSLA shorts:
from 6.5 short ratio last year to 1 (short ratio) days to cover
from almost 40 million shares short last year this time to 12 million shares short. 🧐

Total SI of 103 stocks as of July 15 reporting
Total SI continued its decline as catapults to all time high
Lowest short interest in more than a year.
notice:
1 total capitulation in Jan 15 & 31
2 what happened in Feb/Mar?
3 then Mar 31 and recent capitulation
Total SI continued its decline as catapults to all time high
Lowest short interest in more than a year.
notice:
1 total capitulation in Jan 15 & 31
2 what happened in Feb/Mar?
3 then Mar 31 and recent capitulation

QQQ 103 stocks: top 52 stocks
This table contains tons of information:
1 today's price & chg
2 short interest & days to cover
3 market cap as of today
4 % weight as of today
ranked by short ratio (days-to-cover)
top SI 52 stocks
This table contains tons of information:
1 today's price & chg
2 short interest & days to cover
3 market cap as of today
4 % weight as of today
ranked by short ratio (days-to-cover)
top SI 52 stocks

QQQ 103 stocks: bottom 51 stocks in term of short-ratio
This table contains tons of information:
1 today's price & chg
2 short interest & days to cover
3 market cap as of today
4 % weight as of today
ranked by short ratio (days-to-cover)
bottom 51 stocks
This table contains tons of information:
1 today's price & chg
2 short interest & days to cover
3 market cap as of today
4 % weight as of today
ranked by short ratio (days-to-cover)
bottom 51 stocks

sharing some of my favorite screeners
I just don't have the time to monitor myself
super euphoria screen: last column
total call volume / total OI call vol
> 1 = FOMO (TSLA? deep OTM calls)
> 0.75 =euphoria
> 0.5 =greed
Useful? anything interesting, let us know
I just don't have the time to monitor myself
super euphoria screen: last column
total call volume / total OI call vol
> 1 = FOMO (TSLA? deep OTM calls)
> 0.75 =euphoria
> 0.5 =greed
Useful? anything interesting, let us know

Screener:
high Implied volatility vs low historical volatility
IVX30 / HV30 ratio
> 2 ==> extreme fear (pending scandals? drug approval?)
> 1.5 ==> fear (pending bad earnings?)
high Implied volatility vs low historical volatility
IVX30 / HV30 ratio
> 2 ==> extreme fear (pending scandals? drug approval?)
> 1.5 ==> fear (pending bad earnings?)

Screener:
Highest volume Put/Call Ratio from yesterday:
Vol-PCR column (red) in the middle:
> 50 ==> extreme bearish (sky is falling, all-in puts)
> 20 ==> super-duper bearish
> 5 ==> bearish
Highest volume Put/Call Ratio from yesterday:
Vol-PCR column (red) in the middle:
> 50 ==> extreme bearish (sky is falling, all-in puts)
> 20 ==> super-duper bearish
> 5 ==> bearish
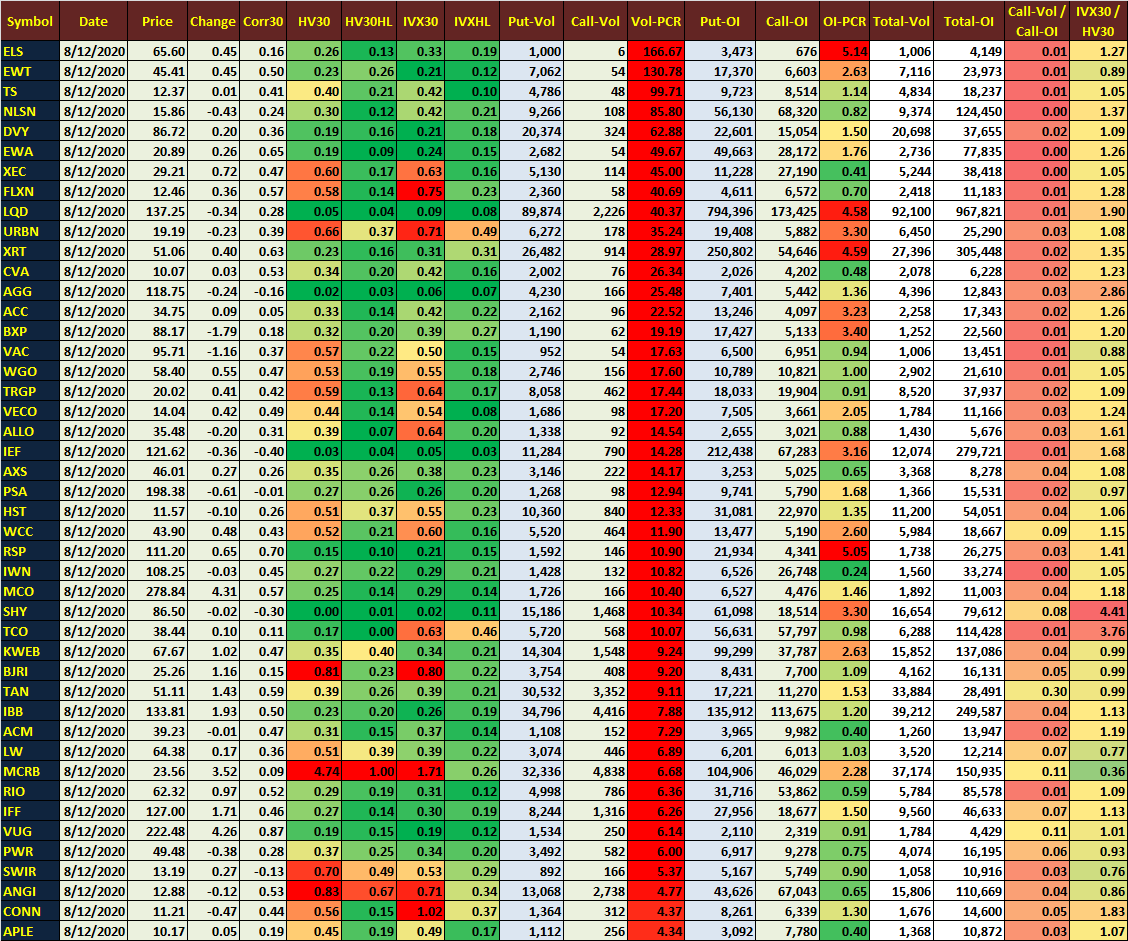
Highest OI Put/Call Ratio
OI-PCR column in the middle:
> 10 ==> extreme bearish (sky is falling, all-in puts)
> 4 ==> super-duper bearish
> 2 ==> bearish
OI-PCR column in the middle:
> 10 ==> extreme bearish (sky is falling, all-in puts)
> 4 ==> super-duper bearish
> 2 ==> bearish

Conditions for the above screens:
1 share price > $10
2 total options volume traded daily > 1,000 contracts
3 total OI > 4,000 contracts
down from 3,200 stocks/ETFs to about 900 tickers.
1 share price > $10
2 total options volume traded daily > 1,000 contracts
3 total OI > 4,000 contracts
down from 3,200 stocks/ETFs to about 900 tickers.
My best "pending news" screen
1 Implied volatility (IV) highest increase in 5 days =fear
2 Vol-PCR also increase in last 1 day & 5 days =fear
3 looking for "red" cells across the rows
looks interesting:
5-day IV increased by 38%
Vol_PCR-1d up 203%
Vol-PCR-5d up 190%
1 Implied volatility (IV) highest increase in 5 days =fear
2 Vol-PCR also increase in last 1 day & 5 days =fear
3 looking for "red" cells across the rows
looks interesting:
5-day IV increased by 38%
Vol_PCR-1d up 203%
Vol-PCR-5d up 190%

Wow... shocking.. extreme bearish tickers.
The highest 1-day & 5-day % change in Vol-PCR
along with the high Put-Volume > 2000 contracts.
The highest 1-day & 5-day % change in Vol-PCR
along with the high Put-Volume > 2000 contracts.

• • •
Missing some Tweet in this thread? You can try to
force a refresh